Zip Codes with the Highest Percentage of Population Employed in Arts, Entertainment & Recreation in Wichita, KS
RELATED REPORTS & OPTIONS
Arts, Entertainment & Recreation
Wichita
Compare Zip Codes
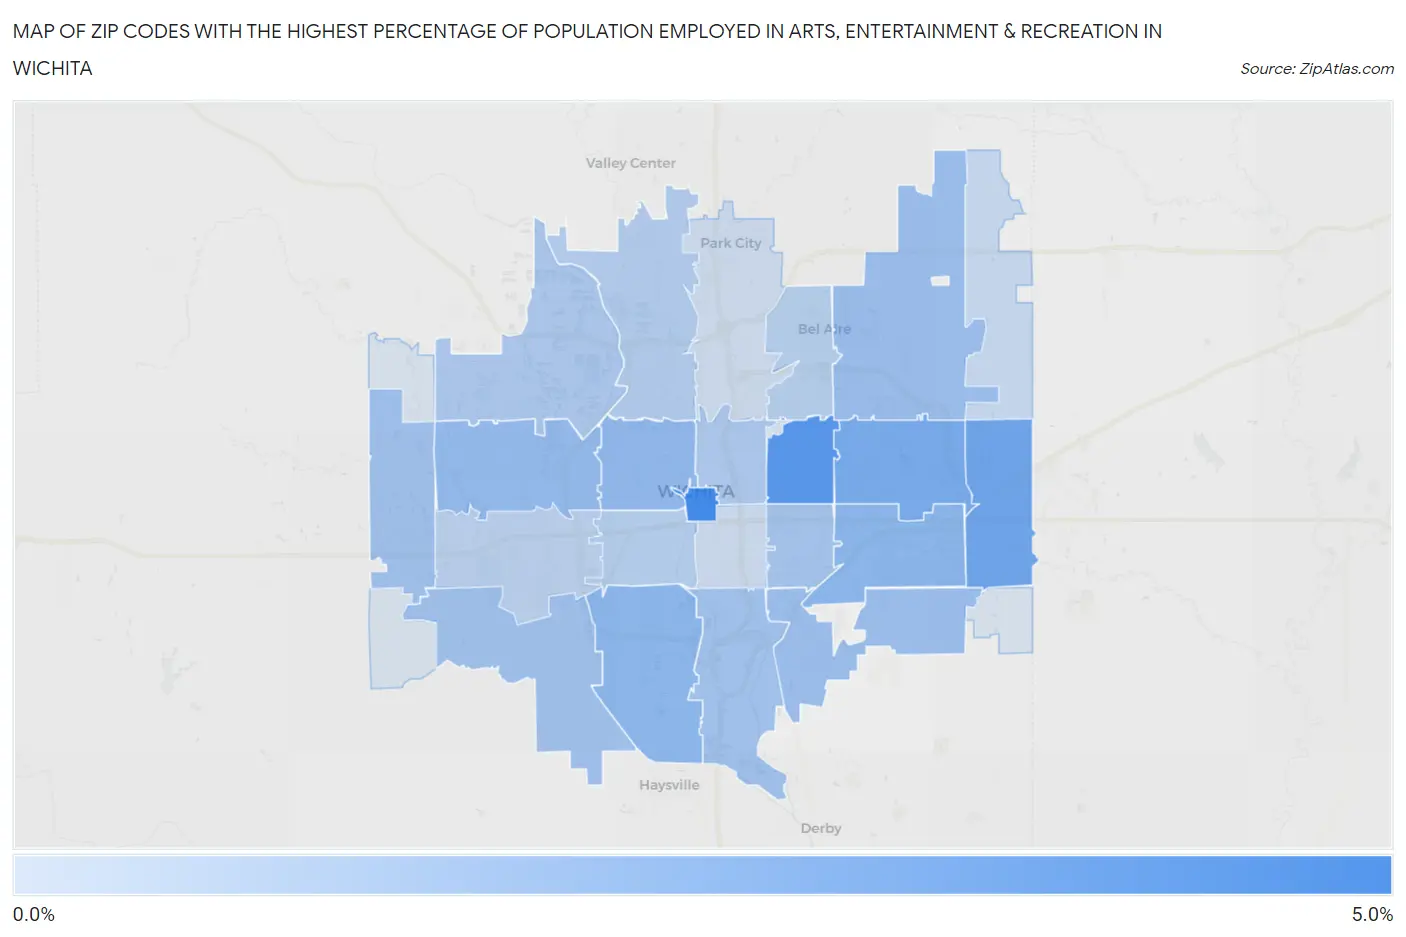
Map of Zip Codes with the Highest Percentage of Population Employed in Arts, Entertainment & Recreation in Wichita
0.0%
5.0%
Zip Codes with the Highest Percentage of Population Employed in Arts, Entertainment & Recreation in Wichita, KS
| Zip Code | % Employed | vs State | vs National | |
| 1. | 67202 | 4.2% | 1.7%(+2.48)#33 | 2.1%(+2.15)#3,043 |
| 2. | 67208 | 3.6% | 1.7%(+1.89)#45 | 2.1%(+1.56)#3,878 |
| 3. | 67230 | 2.9% | 1.7%(+1.20)#66 | 2.1%(+0.867)#5,506 |
| 4. | 67206 | 2.7% | 1.7%(+0.965)#78 | 2.1%(+0.630)#6,311 |
| 5. | 67207 | 2.1% | 1.7%(+0.394)#118 | 2.1%(+0.059)#8,984 |
| 6. | 67217 | 2.1% | 1.7%(+0.344)#122 | 2.1%(+0.008)#9,268 |
| 7. | 67203 | 2.0% | 1.7%(+0.260)#132 | 2.1%(-0.076)#9,739 |
| 8. | 67212 | 1.9% | 1.7%(+0.119)#157 | 2.1%(-0.217)#10,577 |
| 9. | 67226 | 1.8% | 1.7%(+0.016)#169 | 2.1%(-0.320)#11,275 |
| 10. | 67210 | 1.7% | 1.7%(-0.013)#176 | 2.1%(-0.348)#11,487 |
| 11. | 67235 | 1.6% | 1.7%(-0.164)#201 | 2.1%(-0.499)#12,586 |
| 12. | 67216 | 1.6% | 1.7%(-0.174)#205 | 2.1%(-0.510)#12,678 |
| 13. | 67215 | 1.6% | 1.7%(-0.179)#207 | 2.1%(-0.515)#12,723 |
| 14. | 67218 | 1.5% | 1.7%(-0.243)#210 | 2.1%(-0.578)#13,212 |
| 15. | 67205 | 1.3% | 1.7%(-0.462)#251 | 2.1%(-0.797)#14,825 |
| 16. | 67214 | 1.2% | 1.7%(-0.518)#257 | 2.1%(-0.854)#15,271 |
| 17. | 67204 | 1.1% | 1.7%(-0.640)#275 | 2.1%(-0.976)#16,187 |
| 18. | 67213 | 1.0% | 1.7%(-0.717)#283 | 2.1%(-1.05)#16,737 |
| 19. | 67220 | 0.98% | 1.7%(-0.764)#290 | 2.1%(-1.10)#17,098 |
| 20. | 67209 | 0.83% | 1.7%(-0.912)#316 | 2.1%(-1.25)#18,163 |
| 21. | 67228 | 0.55% | 1.7%(-1.20)#350 | 2.1%(-1.53)#20,190 |
| 22. | 67211 | 0.42% | 1.7%(-1.32)#367 | 2.1%(-1.66)#20,959 |
| 23. | 67219 | 0.31% | 1.7%(-1.44)#393 | 2.1%(-1.78)#21,687 |
1
Common Questions
What are the Top 10 Zip Codes with the Highest Percentage of Population Employed in Arts, Entertainment & Recreation in Wichita, KS?
Top 10 Zip Codes with the Highest Percentage of Population Employed in Arts, Entertainment & Recreation in Wichita, KS are:
What zip code has the Highest Percentage of Population Employed in Arts, Entertainment & Recreation in Wichita, KS?
67202 has the Highest Percentage of Population Employed in Arts, Entertainment & Recreation in Wichita, KS with 4.2%.
What is the Percentage of Population Employed in Arts, Entertainment & Recreation in Wichita, KS?
Percentage of Population Employed in Arts, Entertainment & Recreation in Wichita is 1.8%.
What is the Percentage of Population Employed in Arts, Entertainment & Recreation in Kansas?
Percentage of Population Employed in Arts, Entertainment & Recreation in Kansas is 1.7%.
What is the Percentage of Population Employed in Arts, Entertainment & Recreation in the United States?
Percentage of Population Employed in Arts, Entertainment & Recreation in the United States is 2.1%.