Zip Codes with the Highest Percentage of Population Employed in Farming, Fishing & Forestry in Wichita, KS

RELATED REPORTS & OPTIONS

Farming, Fishing & Forestry
Population
Families and Households
Female Fertility
Female Fertility (Unmarried)
Race (Community Size)
Race (Percentage)
Ancestry (Community Size)
AfricanAlaska NativeAmericanApacheArabArapahoArgentineanArmenianAustralianAustrianBangladeshiBarbadianBelgianBhutaneseBlackfeetBolivianBrazilianBritishBulgarianBurmeseCajunCanadianCelticCentral AmericanCentral American IndianCherokeeCheyenneChickasawChileanChippewaChoctawColombianComancheCosta RicanCreekCroatianCubanCzechCzechoslovakianDanishDelawareDominicanDutchDutch West IndianEastern EuropeanEcuadorianEgyptianEnglishEthiopianEuropeanFilipinoFinnishFrenchFrench American IndianFrench CanadianGermanGerman RussianGhanaianGreekGuamanian / ChamorroGuatemalanHaitianHonduranHungarianIcelanderIndian (Asian)IndonesianInupiatIranianIrishIroquoisItalianJamaicanJapaneseJordanianKenyanKiowaKoreanLaotianLebaneseLithuanianLuxembourgerMalaysianMexicanMexican American IndianMongolianMoroccanNative HawaiianNavajoNicaraguanNigerianNorthern EuropeanNorwegianOsageOttawaPakistaniPalestinianPanamanianParaguayanPennsylvania GermanPeruvianPimaPolishPortuguesePotawatomiPuebloPuerto RicanRomanianRussianSalvadoranSamoanScandinavianScotch-IrishScottishSeminoleSiouxSlavicSlovakSloveneSouth AfricanSouth AmericanSpaniardSpanishSpanish AmericanSpanish American IndianSri LankanSubsaharan AfricanSwedishSwissSyrianThaiTrinidadian and TobagonianTurkishUgandanUkrainianVenezuelanWelshWest IndianYugoslavian
Ancestry (Percentage)
AfricanAlaska NativeAmericanApacheArabArapahoArgentineanArmenianAustralianAustrianBangladeshiBarbadianBelgianBhutaneseBlackfeetBolivianBrazilianBritishBulgarianBurmeseCajunCanadianCelticCentral AmericanCentral American IndianCherokeeCheyenneChickasawChileanChippewaChoctawColombianComancheCosta RicanCreekCroatianCubanCzechCzechoslovakianDanishDelawareDominicanDutchDutch West IndianEastern EuropeanEcuadorianEgyptianEnglishEthiopianEuropeanFilipinoFinnishFrenchFrench American IndianFrench CanadianGermanGerman RussianGhanaianGreekGuamanian / ChamorroGuatemalanHaitianHonduranHungarianIcelanderIndian (Asian)IndonesianInupiatIranianIrishIroquoisItalianJamaicanJapaneseJordanianKenyanKiowaKoreanLaotianLebaneseLithuanianLuxembourgerMalaysianMexicanMexican American IndianMongolianMoroccanNative HawaiianNavajoNicaraguanNigerianNorthern EuropeanNorwegianOsageOttawaPakistaniPalestinianPanamanianParaguayanPennsylvania GermanPeruvianPimaPolishPortuguesePotawatomiPuebloPuerto RicanRomanianRussianSalvadoranSamoanScandinavianScotch-IrishScottishSeminoleSiouxSlavicSlovakSloveneSouth AfricanSouth AmericanSpaniardSpanishSpanish AmericanSpanish American IndianSri LankanSubsaharan AfricanSwedishSwissSyrianThaiTrinidadian and TobagonianTurkishUgandanUkrainianVenezuelanWelshWest IndianYugoslavian
Immigrant Origin (Total)
Immigrant Origin (Percentage)
Income
Income (Families)
Income (Households)
Poverty
Poverty (Families)
Unemployment
Employment Occupations
Employment Industries
Employer Class
Commute Time
Commute Means
School Enrollment
Education by Degree Field
Occupancy
Finances
Physical Characteristics
Wichita
Compare Zip Codes
Comparison Subject

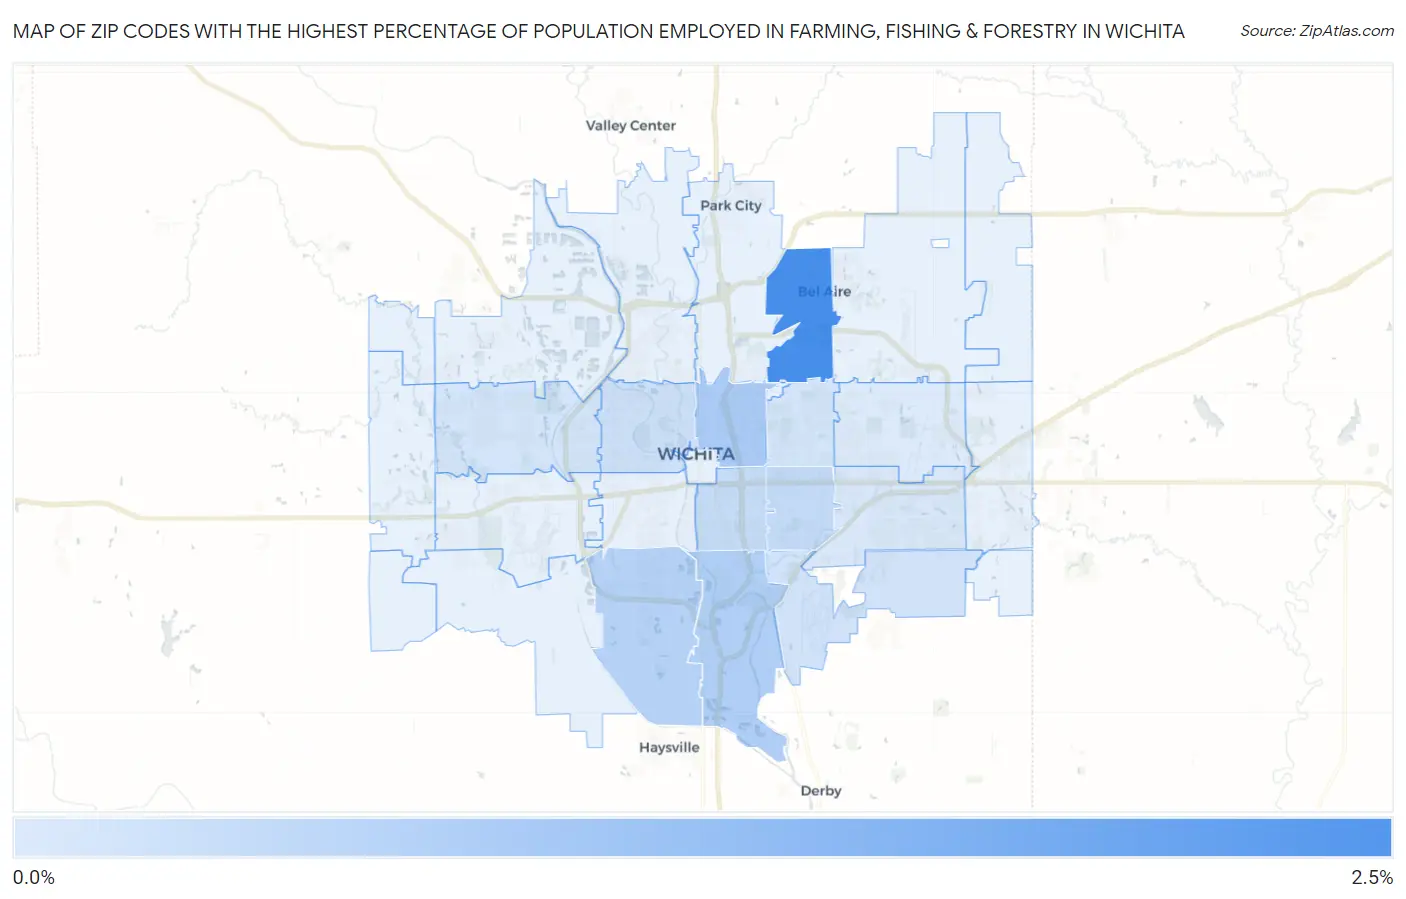
Map of Zip Codes with the Highest Percentage of Population Employed in Farming, Fishing & Forestry in Wichita

0.0%
2.5%
Zip Codes with the Highest Percentage of Population Employed in Farming, Fishing & Forestry in Wichita Map

Zip Codes with the Highest Percentage of Population Employed in Farming, Fishing & Forestry in Wichita, KS

Zip Code % Employed vs State vs National
1.672202.0%0.91%(+1.12)#2270.61%(+1.42)#6,480
2.672140.74%0.91%(-0.173)#3530.61%(+0.132)#11,150
3.672160.64%0.91%(-0.268)#3640.61%(+0.037)#11,749
4.672170.57%0.91%(-0.340)#3750.61%(-0.035)#12,294
5.672180.40%0.91%(-0.514)#3990.61%(-0.210)#13,795
6.672110.38%0.91%(-0.534)#4010.61%(-0.229)#13,981
7.672030.26%0.91%(-0.648)#4160.61%(-0.343)#15,258
8.672100.22%0.91%(-0.686)#4220.61%(-0.382)#15,782
9.672080.19%0.91%(-0.725)#4270.61%(-0.420)#16,346
10.672120.18%0.91%(-0.732)#4320.61%(-0.427)#16,445
11.672070.13%0.91%(-0.782)#4380.61%(-0.478)#17,304
12.672060.064%0.91%(-0.847)#4490.61%(-0.542)#18,404

Common Questions

What are the Top 10 Zip Codes with the Highest Percentage of Population Employed in Farming, Fishing & Forestry in Wichita, KS?
Top 10 Zip Codes with the Highest Percentage of Population Employed in Farming, Fishing & Forestry in Wichita, KS are:
#1
2.0%
#2
0.74%
#3
0.64%
#4
0.57%
#5
0.40%
#6
0.38%
#7
0.26%
#8
0.22%
#9
0.19%
#10
0.18%
What zip code has the Highest Percentage of Population Employed in Farming, Fishing & Forestry in Wichita, KS?
67220 has the Highest Percentage of Population Employed in Farming, Fishing & Forestry in Wichita, KS with 2.0%.
What is the Percentage of Population Employed in Farming, Fishing & Forestry in Wichita, KS?
Percentage of Population Employed in Farming, Fishing & Forestry in Wichita is 0.28%.
What is the Percentage of Population Employed in Farming, Fishing & Forestry in Kansas?
Percentage of Population Employed in Farming, Fishing & Forestry in Kansas is 0.91%.
What is the Percentage of Population Employed in Farming, Fishing & Forestry in the United States?
Percentage of Population Employed in Farming, Fishing & Forestry in the United States is 0.61%.