Zip Codes with the Highest Percentage of Population Employed in Sales & Related in Topeka, KS
RELATED REPORTS & OPTIONS
Sales & Related
Topeka
Compare Zip Codes
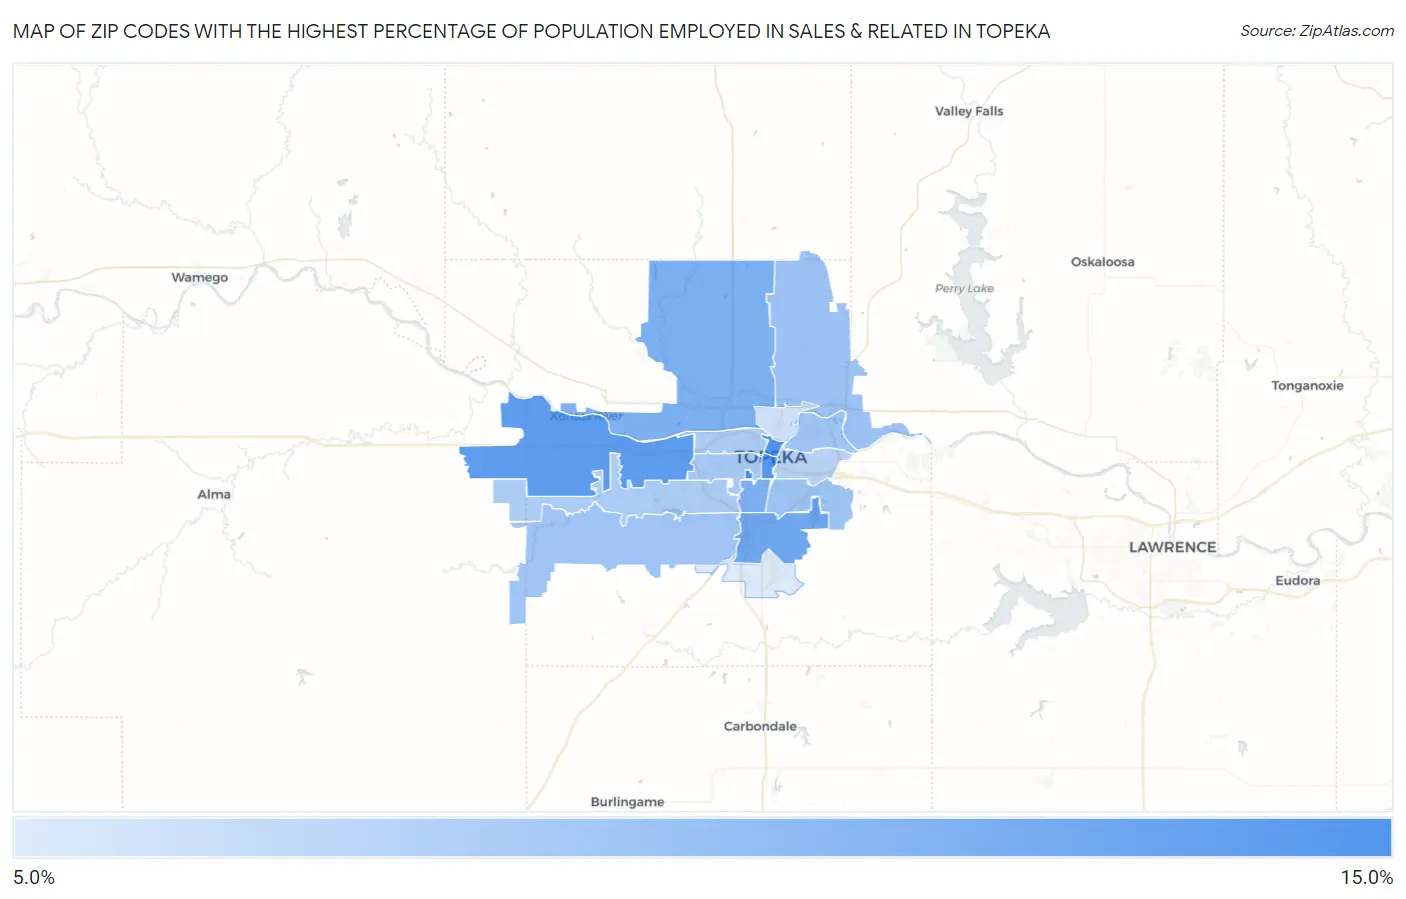
Map of Zip Codes with the Highest Percentage of Population Employed in Sales & Related in Topeka
5.2%
13.6%
Zip Codes with the Highest Percentage of Population Employed in Sales & Related in Topeka, KS
| Zip Code | % Employed | vs State | vs National | |
| 1. | 66621 | 13.6% | 9.3%(+4.32)#54 | 9.6%(+4.00)#3,846 |
| 2. | 66603 | 13.2% | 9.3%(+3.97)#62 | 9.6%(+3.65)#4,226 |
| 3. | 66612 | 13.0% | 9.3%(+3.69)#67 | 9.6%(+3.37)#4,527 |
| 4. | 66615 | 12.3% | 9.3%(+3.01)#82 | 9.6%(+2.69)#5,511 |
| 5. | 66609 | 11.4% | 9.3%(+2.08)#116 | 9.6%(+1.76)#7,360 |
| 6. | 66618 | 10.5% | 9.3%(+1.27)#143 | 9.6%(+0.952)#9,422 |
| 7. | 66611 | 10.4% | 9.3%(+1.17)#149 | 9.6%(+0.849)#9,675 |
| 8. | 66617 | 8.8% | 9.3%(-0.490)#239 | 9.6%(-0.810)#15,317 |
| 9. | 66605 | 8.6% | 9.3%(-0.697)#247 | 9.6%(-1.02)#16,058 |
| 10. | 66616 | 8.4% | 9.3%(-0.841)#256 | 9.6%(-1.16)#16,587 |
| 11. | 66610 | 8.4% | 9.3%(-0.864)#259 | 9.6%(-1.18)#16,666 |
| 12. | 66604 | 8.0% | 9.3%(-1.24)#276 | 9.6%(-1.56)#17,944 |
| 13. | 66606 | 7.8% | 9.3%(-1.43)#290 | 9.6%(-1.75)#18,547 |
| 14. | 66614 | 7.8% | 9.3%(-1.47)#292 | 9.6%(-1.79)#18,669 |
| 15. | 66607 | 7.2% | 9.3%(-2.04)#336 | 9.6%(-2.36)#20,523 |
| 16. | 66608 | 6.0% | 9.3%(-3.29)#412 | 9.6%(-3.61)#23,686 |
| 17. | 66619 | 5.2% | 9.3%(-4.11)#460 | 9.6%(-4.43)#25,286 |
1
Common Questions
What are the Top 10 Zip Codes with the Highest Percentage of Population Employed in Sales & Related in Topeka, KS?
Top 10 Zip Codes with the Highest Percentage of Population Employed in Sales & Related in Topeka, KS are:
What zip code has the Highest Percentage of Population Employed in Sales & Related in Topeka, KS?
66621 has the Highest Percentage of Population Employed in Sales & Related in Topeka, KS with 13.6%.
What is the Percentage of Population Employed in Sales & Related in Topeka, KS?
Percentage of Population Employed in Sales & Related in Topeka is 8.4%.
What is the Percentage of Population Employed in Sales & Related in Kansas?
Percentage of Population Employed in Sales & Related in Kansas is 9.3%.
What is the Percentage of Population Employed in Sales & Related in the United States?
Percentage of Population Employed in Sales & Related in the United States is 9.6%.