Zip Codes with the Highest Percentage of Population Employed in Health Care & Social Assistance in Topeka, KS
RELATED REPORTS & OPTIONS
Health Care & Social Assistance
Topeka
Compare Zip Codes
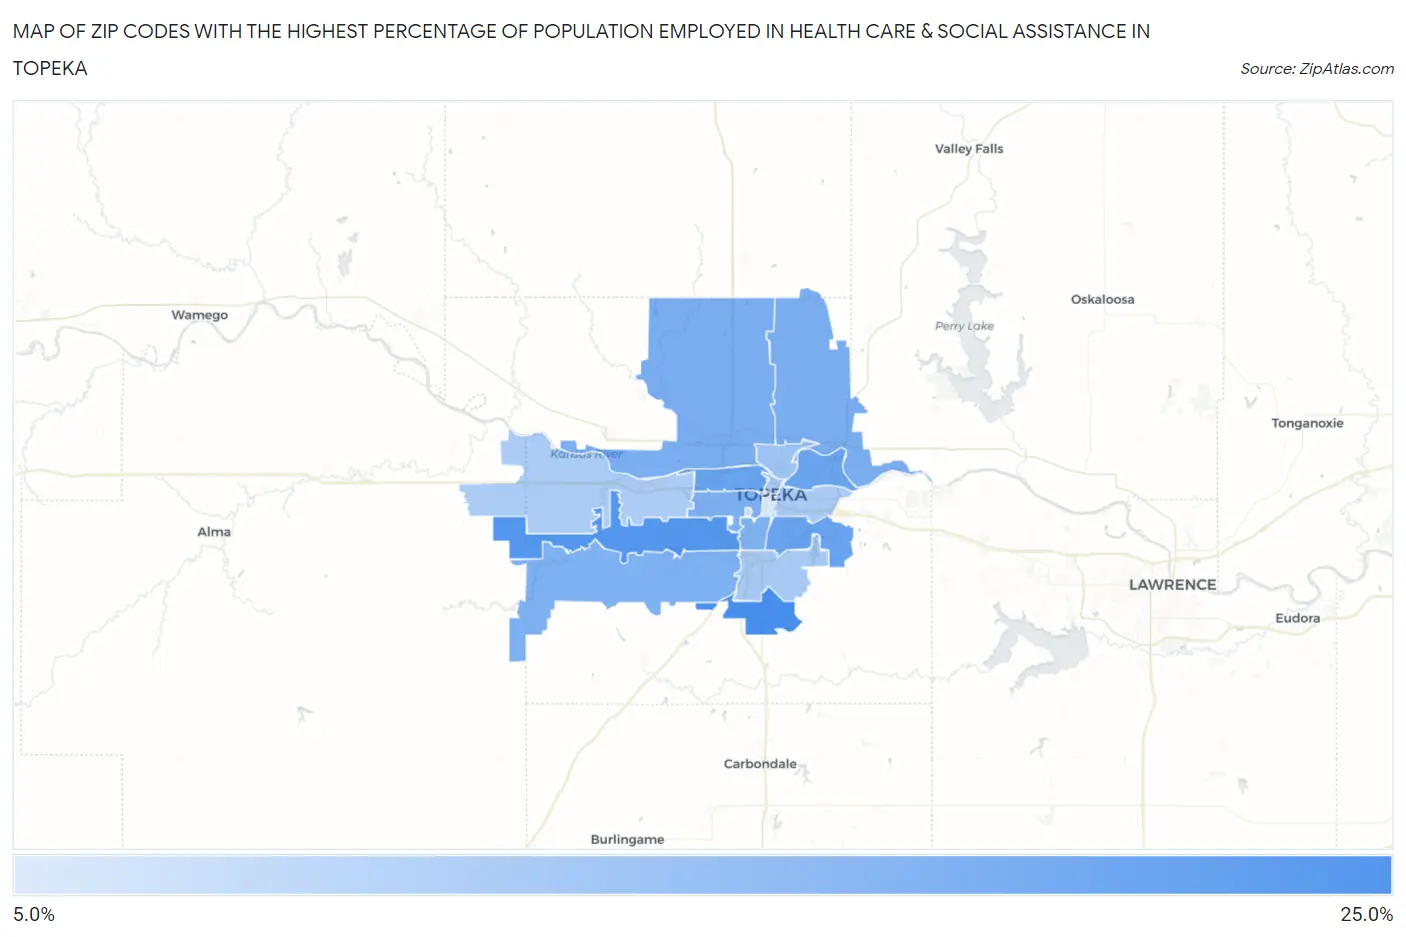
Map of Zip Codes with the Highest Percentage of Population Employed in Health Care & Social Assistance in Topeka
0.0%
25.0%
Zip Codes with the Highest Percentage of Population Employed in Health Care & Social Assistance in Topeka, KS
| Zip Code | % Employed | vs State | vs National | |
| 1. | 66619 | 21.8% | 14.1%(+7.70)#63 | 13.9%(+7.87)#2,904 |
| 2. | 66614 | 20.1% | 14.1%(+5.96)#94 | 13.9%(+6.14)#4,031 |
| 3. | 66605 | 17.9% | 14.1%(+3.75)#149 | 13.9%(+3.93)#6,370 |
| 4. | 66606 | 17.8% | 14.1%(+3.68)#154 | 13.9%(+3.86)#6,478 |
| 5. | 66616 | 17.6% | 14.1%(+3.49)#162 | 13.9%(+3.67)#6,781 |
| 6. | 66618 | 16.1% | 14.1%(+1.96)#223 | 13.9%(+2.14)#9,361 |
| 7. | 66617 | 16.0% | 14.1%(+1.86)#227 | 13.9%(+2.04)#9,557 |
| 8. | 66604 | 15.5% | 14.1%(+1.44)#242 | 13.9%(+1.61)#10,405 |
| 9. | 66610 | 15.5% | 14.1%(+1.37)#245 | 13.9%(+1.55)#10,548 |
| 10. | 66611 | 15.2% | 14.1%(+1.12)#254 | 13.9%(+1.30)#11,114 |
| 11. | 66608 | 11.9% | 14.1%(-2.18)#409 | 13.9%(-2.01)#19,175 |
| 12. | 66609 | 11.0% | 14.1%(-3.12)#448 | 13.9%(-2.94)#21,372 |
| 13. | 66607 | 10.7% | 14.1%(-3.43)#469 | 13.9%(-3.25)#22,054 |
| 14. | 66603 | 10.6% | 14.1%(-3.54)#477 | 13.9%(-3.37)#22,309 |
| 15. | 66615 | 10.5% | 14.1%(-3.62)#479 | 13.9%(-3.44)#22,455 |
| 16. | 66621 | 7.9% | 14.1%(-6.22)#561 | 13.9%(-6.04)#26,603 |
| 17. | 66612 | 5.3% | 14.1%(-8.78)#608 | 13.9%(-8.60)#28,859 |
1
Common Questions
What are the Top 10 Zip Codes with the Highest Percentage of Population Employed in Health Care & Social Assistance in Topeka, KS?
Top 10 Zip Codes with the Highest Percentage of Population Employed in Health Care & Social Assistance in Topeka, KS are:
What zip code has the Highest Percentage of Population Employed in Health Care & Social Assistance in Topeka, KS?
66619 has the Highest Percentage of Population Employed in Health Care & Social Assistance in Topeka, KS with 21.8%.
What is the Percentage of Population Employed in Health Care & Social Assistance in Topeka, KS?
Percentage of Population Employed in Health Care & Social Assistance in Topeka is 16.9%.
What is the Percentage of Population Employed in Health Care & Social Assistance in Kansas?
Percentage of Population Employed in Health Care & Social Assistance in Kansas is 14.1%.
What is the Percentage of Population Employed in Health Care & Social Assistance in the United States?
Percentage of Population Employed in Health Care & Social Assistance in the United States is 13.9%.