Zip Codes with the Highest Percentage of Hispanic or Latino Population in Shawnee, KS
RELATED REPORTS & OPTIONS
Hispanic or Latino
Shawnee
Compare Zip Codes
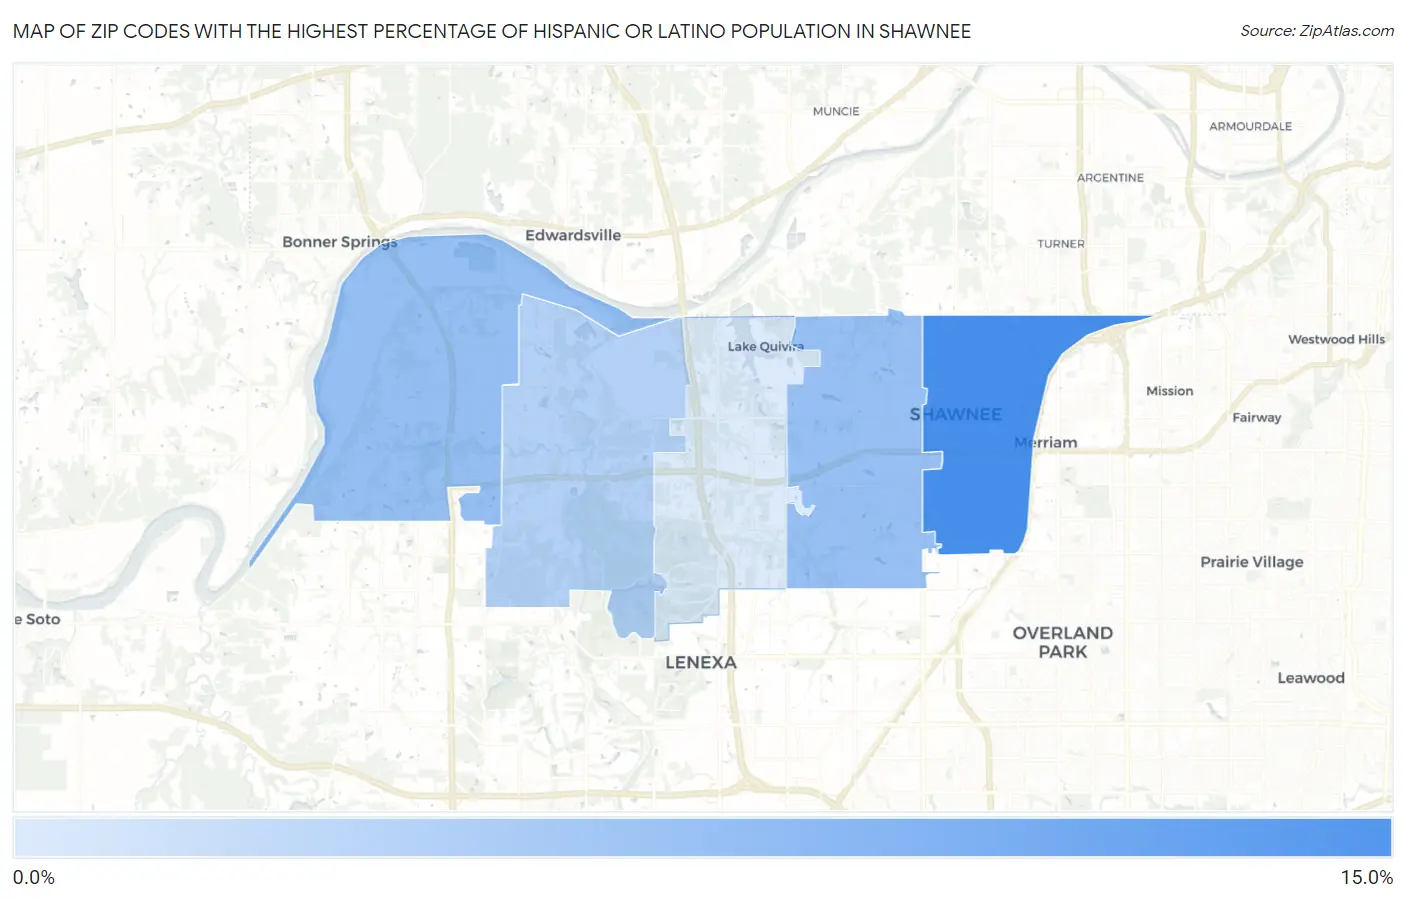
Map of Zip Codes with the Highest Percentage of Hispanic or Latino Population in Shawnee
2.5%
11.6%
Zip Codes with the Highest Percentage of Hispanic or Latino Population in Shawnee, KS
| Zip Code | Hispanic or Latino | vs State | vs National | |
| 1. | 66203 | 11.6% | 12.6%(-1.04)#122 | 18.7%(-7.09)#7,991 |
| 2. | 66226 | 6.8% | 12.6%(-5.84)#218 | 18.7%(-11.9)#11,882 |
| 3. | 66216 | 6.6% | 12.6%(-6.03)#221 | 18.7%(-12.1)#12,100 |
| 4. | 66218 | 5.0% | 12.6%(-7.59)#278 | 18.7%(-13.6)#14,267 |
| 5. | 66217 | 2.5% | 12.6%(-10.1)#429 | 18.7%(-16.1)#19,592 |
1
Common Questions
What are the Top 3 Zip Codes with the Highest Percentage of Hispanic or Latino Population in Shawnee, KS?
Top 3 Zip Codes with the Highest Percentage of Hispanic or Latino Population in Shawnee, KS are:
What zip code has the Highest Percentage of Hispanic or Latino Population in Shawnee, KS?
66203 has the Highest Percentage of Hispanic or Latino Population in Shawnee, KS with 11.6%.
What is the Percentage of Hispanic or Latino Population in Shawnee, KS?
Percentage of Hispanic or Latino Population in Shawnee is 7.8%.
What is the Percentage of Hispanic or Latino Population in Kansas?
Percentage of Hispanic or Latino Population in Kansas is 12.6%.
What is the Percentage of Hispanic or Latino Population in the United States?
Percentage of Hispanic or Latino Population in the United States is 18.7%.