Zip Codes with the Highest Percentage of Black / African American Population in Mission, KS
RELATED REPORTS & OPTIONS
Black / African American
Mission
Compare Zip Codes
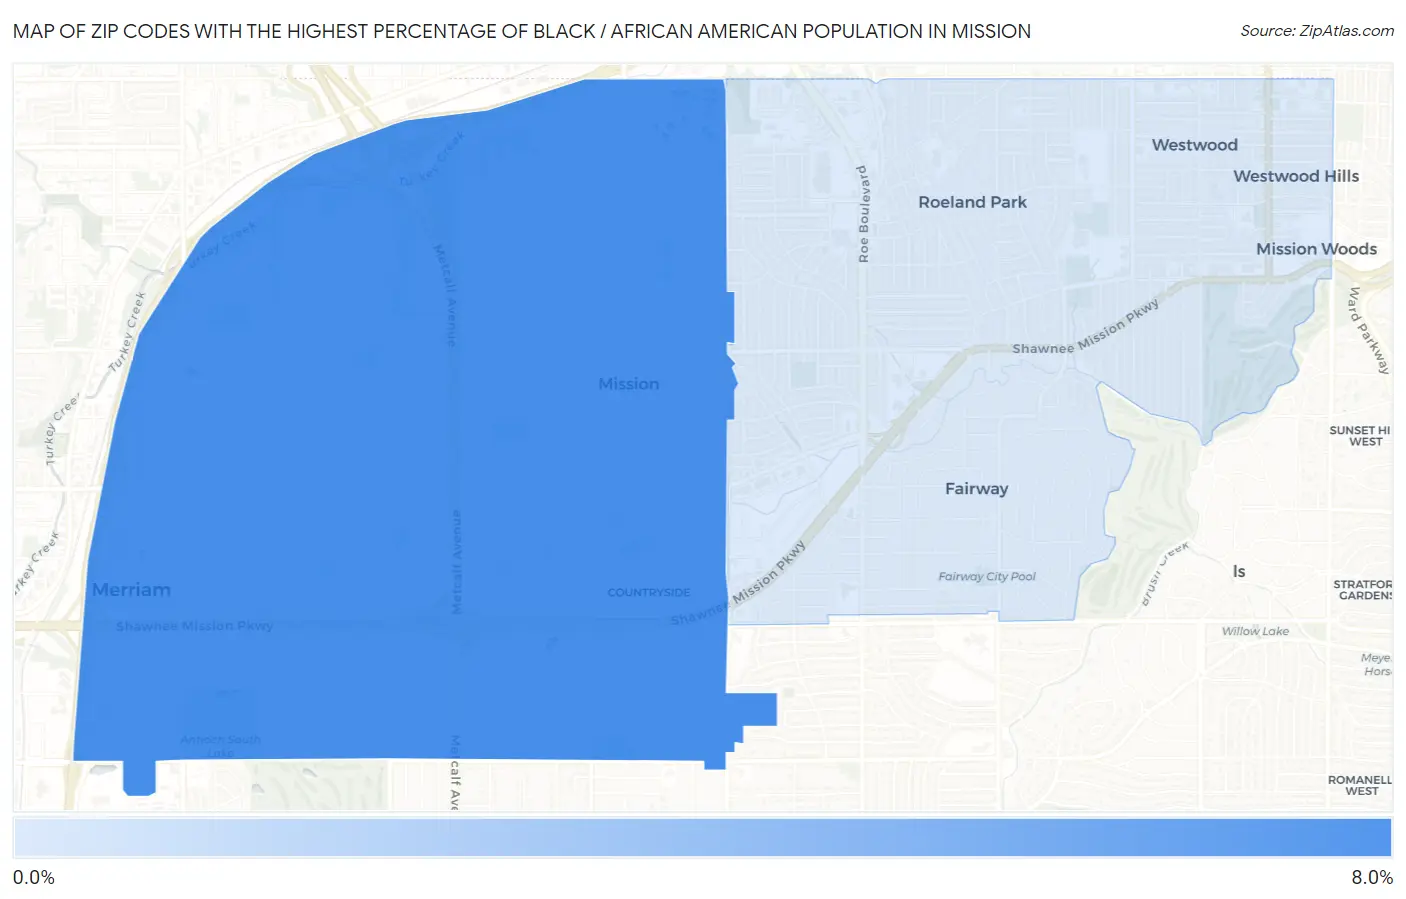
Map of Zip Codes with the Highest Percentage of Black / African American Population in Mission
1.4%
7.8%
Zip Codes with the Highest Percentage of Black / African American Population in Mission, KS
| Zip Code | Black / African American | vs State | vs National | |
| 1. | 66202 | 7.8% | 5.6%(+2.27)#46 | 12.5%(-4.63)#7,618 |
| 2. | 66205 | 1.4% | 5.6%(-4.22)#190 | 12.5%(-11.1)#15,268 |
1
Common Questions
What are the Top Zip Codes with the Highest Percentage of Black / African American Population in Mission, KS?
Top Zip Codes with the Highest Percentage of Black / African American Population in Mission, KS are:
What zip code has the Highest Percentage of Black / African American Population in Mission, KS?
66202 has the Highest Percentage of Black / African American Population in Mission, KS with 7.8%.
What is the Percentage of Black / African American Population in Mission, KS?
Percentage of Black / African American Population in Mission is 4.8%.
What is the Percentage of Black / African American Population in Kansas?
Percentage of Black / African American Population in Kansas is 5.6%.
What is the Percentage of Black / African American Population in the United States?
Percentage of Black / African American Population in the United States is 12.5%.