Zip Codes with the Highest Percentage of Population Employed in Sales & Related in Lenexa, KS
RELATED REPORTS & OPTIONS
Sales & Related
Lenexa
Compare Zip Codes
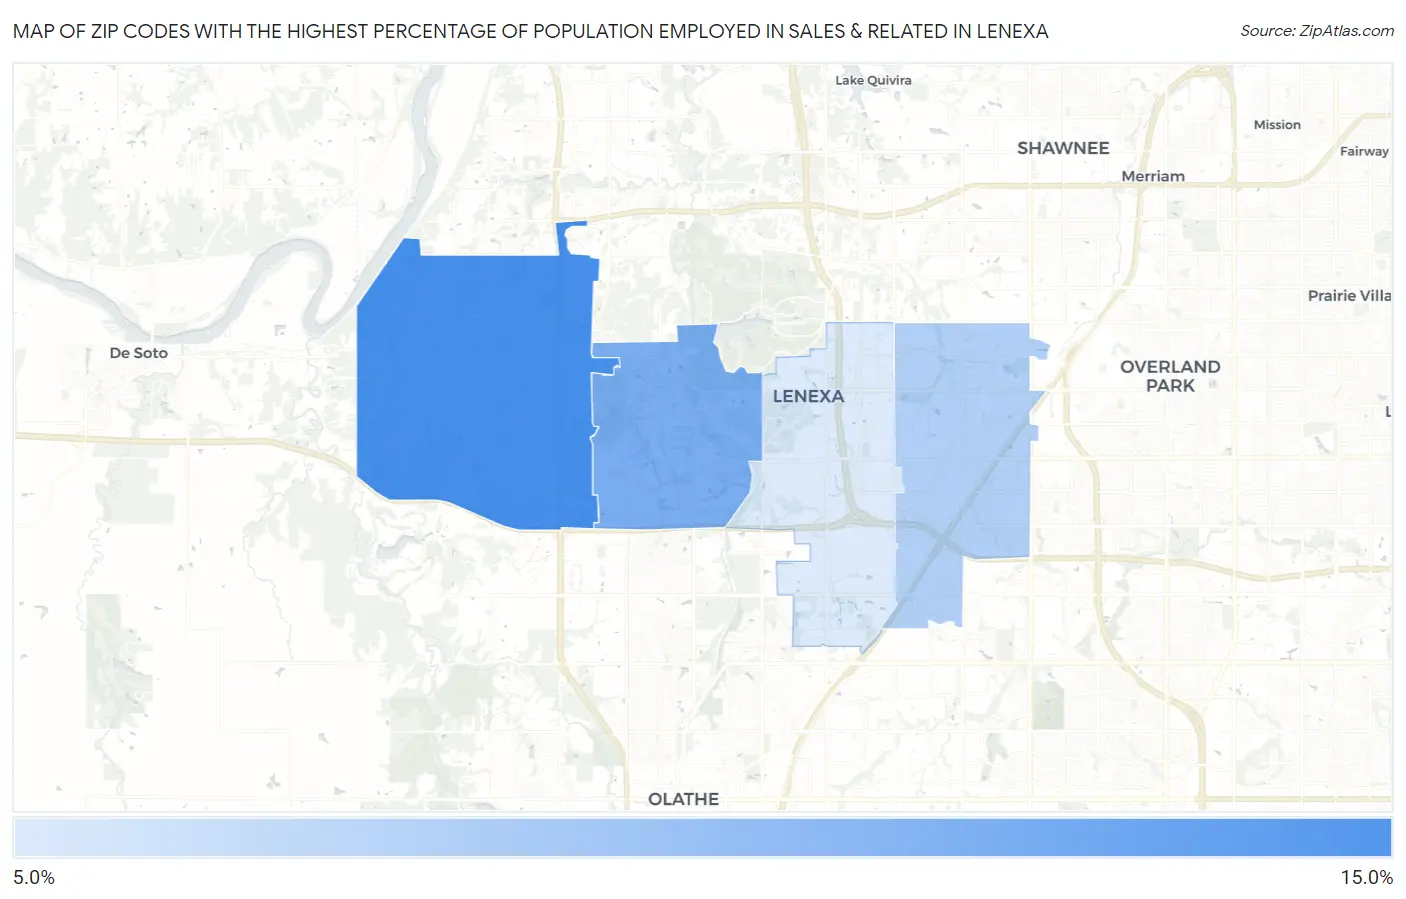
Map of Zip Codes with the Highest Percentage of Population Employed in Sales & Related in Lenexa
9.6%
13.6%
Zip Codes with the Highest Percentage of Population Employed in Sales & Related in Lenexa, KS
| Zip Code | % Employed | vs State | vs National | |
| 1. | 66227 | 13.6% | 9.3%(+4.30)#56 | 9.6%(+3.98)#3,869 |
| 2. | 66220 | 12.2% | 9.3%(+2.93)#85 | 9.6%(+2.61)#5,654 |
| 3. | 66215 | 10.8% | 9.3%(+1.50)#137 | 9.6%(+1.18)#8,796 |
| 4. | 66219 | 9.6% | 9.3%(+0.372)#188 | 9.6%(+0.052)#12,223 |
1
Common Questions
What are the Top 3 Zip Codes with the Highest Percentage of Population Employed in Sales & Related in Lenexa, KS?
Top 3 Zip Codes with the Highest Percentage of Population Employed in Sales & Related in Lenexa, KS are:
What zip code has the Highest Percentage of Population Employed in Sales & Related in Lenexa, KS?
66227 has the Highest Percentage of Population Employed in Sales & Related in Lenexa, KS with 13.6%.
What is the Percentage of Population Employed in Sales & Related in Lenexa, KS?
Percentage of Population Employed in Sales & Related in Lenexa is 10.7%.
What is the Percentage of Population Employed in Sales & Related in Kansas?
Percentage of Population Employed in Sales & Related in Kansas is 9.3%.
What is the Percentage of Population Employed in Sales & Related in the United States?
Percentage of Population Employed in Sales & Related in the United States is 9.6%.