Zip Codes with the Highest Percentage of Population Working from Home in Lenexa, KS
RELATED REPORTS & OPTIONS
Work from Home
Lenexa
Compare Zip Codes
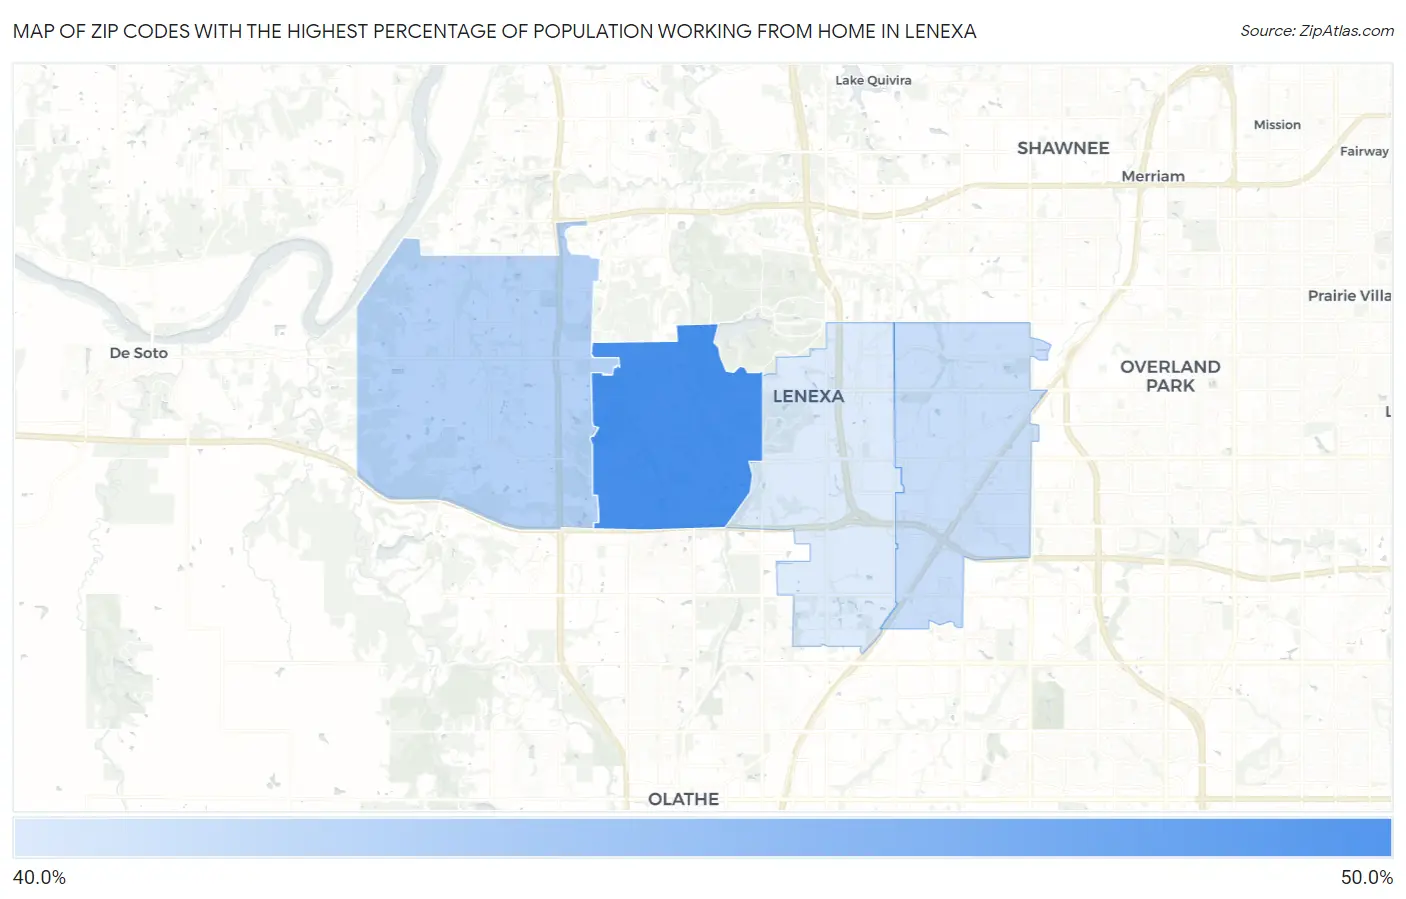
Map of Zip Codes with the Highest Percentage of Population Working from Home in Lenexa
40.6%
45.6%
Zip Codes with the Highest Percentage of Population Working from Home in Lenexa, KS
| Zip Code | % Work from Home | vs State | vs National | |
| 1. | 66220 | 45.6% | 44.4%(+1.20)#293 | 44.0%(+1.60)#13,642 |
| 2. | 66227 | 42.0% | 44.4%(-2.40)#375 | 44.0%(-2.00)#17,736 |
| 3. | 66215 | 41.3% | 44.4%(-3.10)#383 | 44.0%(-2.70)#18,439 |
| 4. | 66219 | 40.6% | 44.4%(-3.80)#391 | 44.0%(-3.40)#19,112 |
1
Common Questions
What are the Top 3 Zip Codes with the Highest Percentage of Population Working from Home in Lenexa, KS?
Top 3 Zip Codes with the Highest Percentage of Population Working from Home in Lenexa, KS are:
What zip code has the Highest Percentage of Population Working from Home in Lenexa, KS?
66220 has the Highest Percentage of Population Working from Home in Lenexa, KS with 45.6%.
What is the Percentage of Population Working from Home in Lenexa, KS?
Percentage of Population Working from Home in Lenexa is 42.5%.
What is the Percentage of Population Working from Home in Kansas?
Percentage of Population Working from Home in Kansas is 44.4%.
What is the Percentage of Population Working from Home in the United States?
Percentage of Population Working from Home in the United States is 44.0%.