Zip Codes with the Highest Percentage of Population Employed in Professional & Scientific Services in Lenexa, KS
RELATED REPORTS & OPTIONS
Professional & Scientific Services
Lenexa
Compare Zip Codes
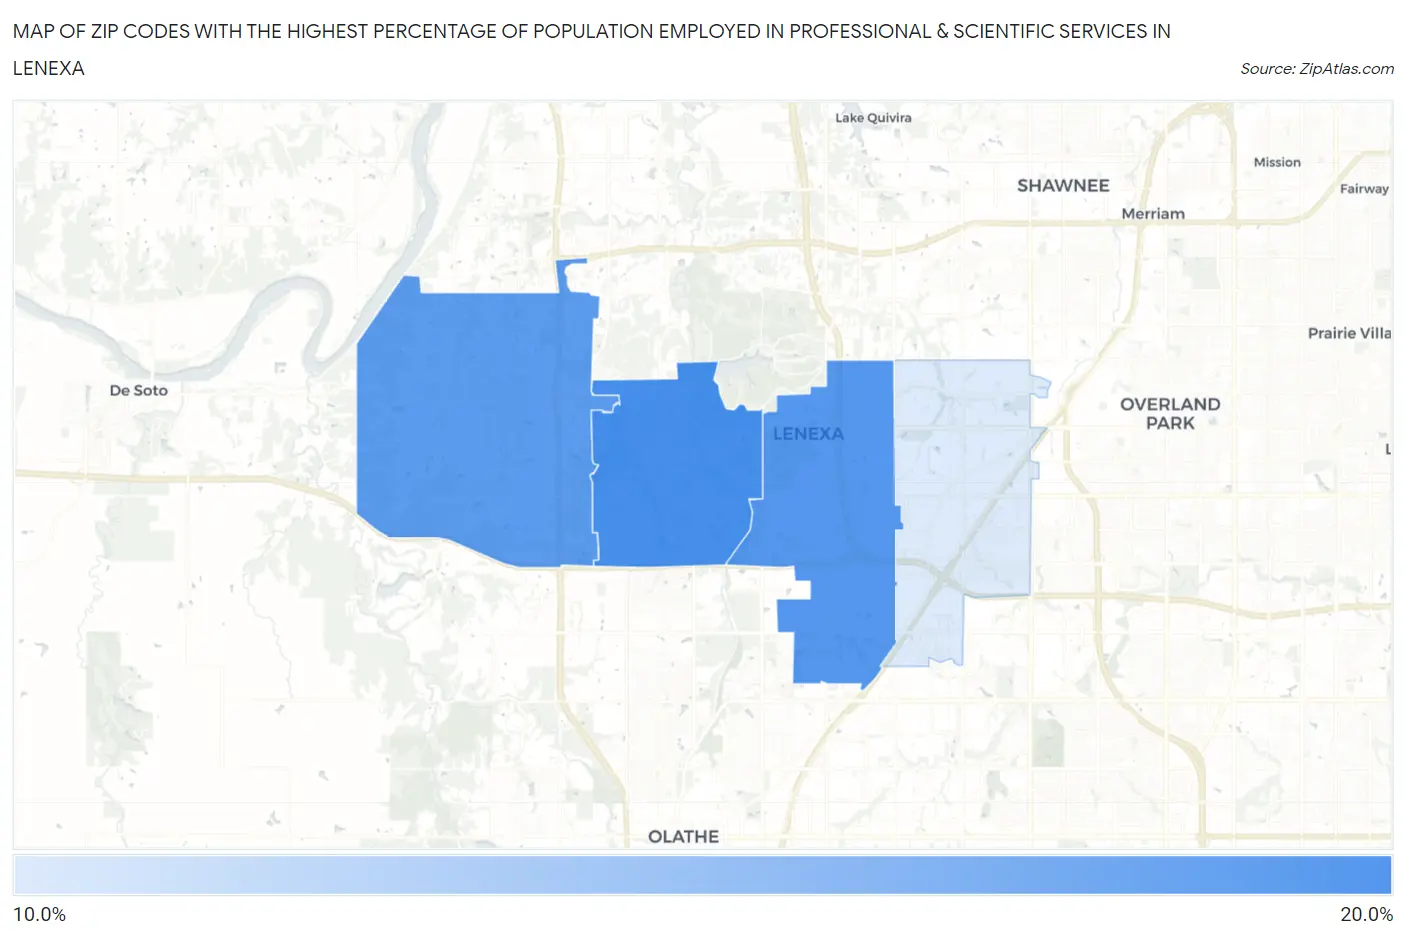
Map of Zip Codes with the Highest Percentage of Population Employed in Professional & Scientific Services in Lenexa
10.7%
15.6%
Zip Codes with the Highest Percentage of Population Employed in Professional & Scientific Services in Lenexa, KS
| Zip Code | % Employed | vs State | vs National | |
| 1. | 66220 | 15.6% | 6.5%(+9.02)#19 | 7.8%(+7.70)#1,730 |
| 2. | 66219 | 15.1% | 6.5%(+8.59)#22 | 7.8%(+7.27)#1,863 |
| 3. | 66227 | 14.9% | 6.5%(+8.36)#24 | 7.8%(+7.04)#1,952 |
| 4. | 66215 | 10.7% | 6.5%(+4.21)#50 | 7.8%(+2.89)#4,013 |
1
Common Questions
What are the Top 3 Zip Codes with the Highest Percentage of Population Employed in Professional & Scientific Services in Lenexa, KS?
Top 3 Zip Codes with the Highest Percentage of Population Employed in Professional & Scientific Services in Lenexa, KS are:
What zip code has the Highest Percentage of Population Employed in Professional & Scientific Services in Lenexa, KS?
66220 has the Highest Percentage of Population Employed in Professional & Scientific Services in Lenexa, KS with 15.6%.
What is the Percentage of Population Employed in Professional & Scientific Services in Lenexa, KS?
Percentage of Population Employed in Professional & Scientific Services in Lenexa is 13.2%.
What is the Percentage of Population Employed in Professional & Scientific Services in Kansas?
Percentage of Population Employed in Professional & Scientific Services in Kansas is 6.5%.
What is the Percentage of Population Employed in Professional & Scientific Services in the United States?
Percentage of Population Employed in Professional & Scientific Services in the United States is 7.8%.