Zip Codes with the Highest Percentage of Hispanic or Latino Population in Lenexa, KS
RELATED REPORTS & OPTIONS
Hispanic or Latino
Lenexa
Compare Zip Codes
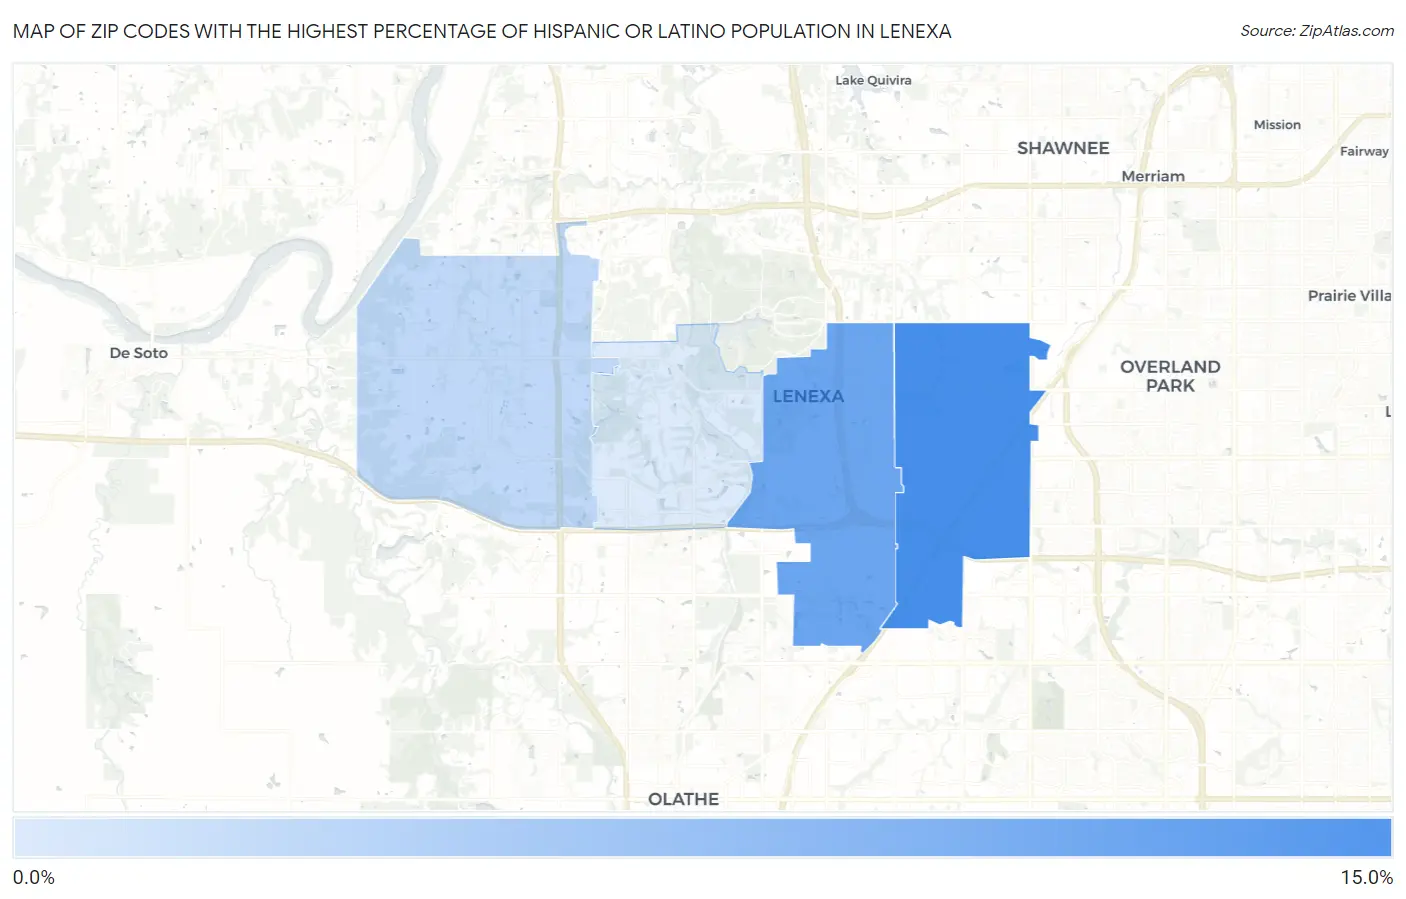
Map of Zip Codes with the Highest Percentage of Hispanic or Latino Population in Lenexa
2.9%
11.8%
Zip Codes with the Highest Percentage of Hispanic or Latino Population in Lenexa, KS
| Zip Code | Hispanic or Latino | vs State | vs National | |
| 1. | 66215 | 11.8% | 12.6%(-0.810)#118 | 18.7%(-6.86)#7,859 |
| 2. | 66219 | 9.5% | 12.6%(-3.12)#149 | 18.7%(-9.17)#9,303 |
| 3. | 66227 | 4.6% | 12.6%(-8.00)#296 | 18.7%(-14.0)#14,971 |
| 4. | 66220 | 2.9% | 12.6%(-9.68)#396 | 18.7%(-15.7)#18,545 |
1
Common Questions
What are the Top 3 Zip Codes with the Highest Percentage of Hispanic or Latino Population in Lenexa, KS?
Top 3 Zip Codes with the Highest Percentage of Hispanic or Latino Population in Lenexa, KS are:
What zip code has the Highest Percentage of Hispanic or Latino Population in Lenexa, KS?
66215 has the Highest Percentage of Hispanic or Latino Population in Lenexa, KS with 11.8%.
What is the Percentage of Hispanic or Latino Population in Lenexa, KS?
Percentage of Hispanic or Latino Population in Lenexa is 9.5%.
What is the Percentage of Hispanic or Latino Population in Kansas?
Percentage of Hispanic or Latino Population in Kansas is 12.6%.
What is the Percentage of Hispanic or Latino Population in the United States?
Percentage of Hispanic or Latino Population in the United States is 18.7%.