Zip Codes with the Highest Percentage of Black / African American Population in Lenexa, KS
RELATED REPORTS & OPTIONS
Black / African American
Lenexa
Compare Zip Codes
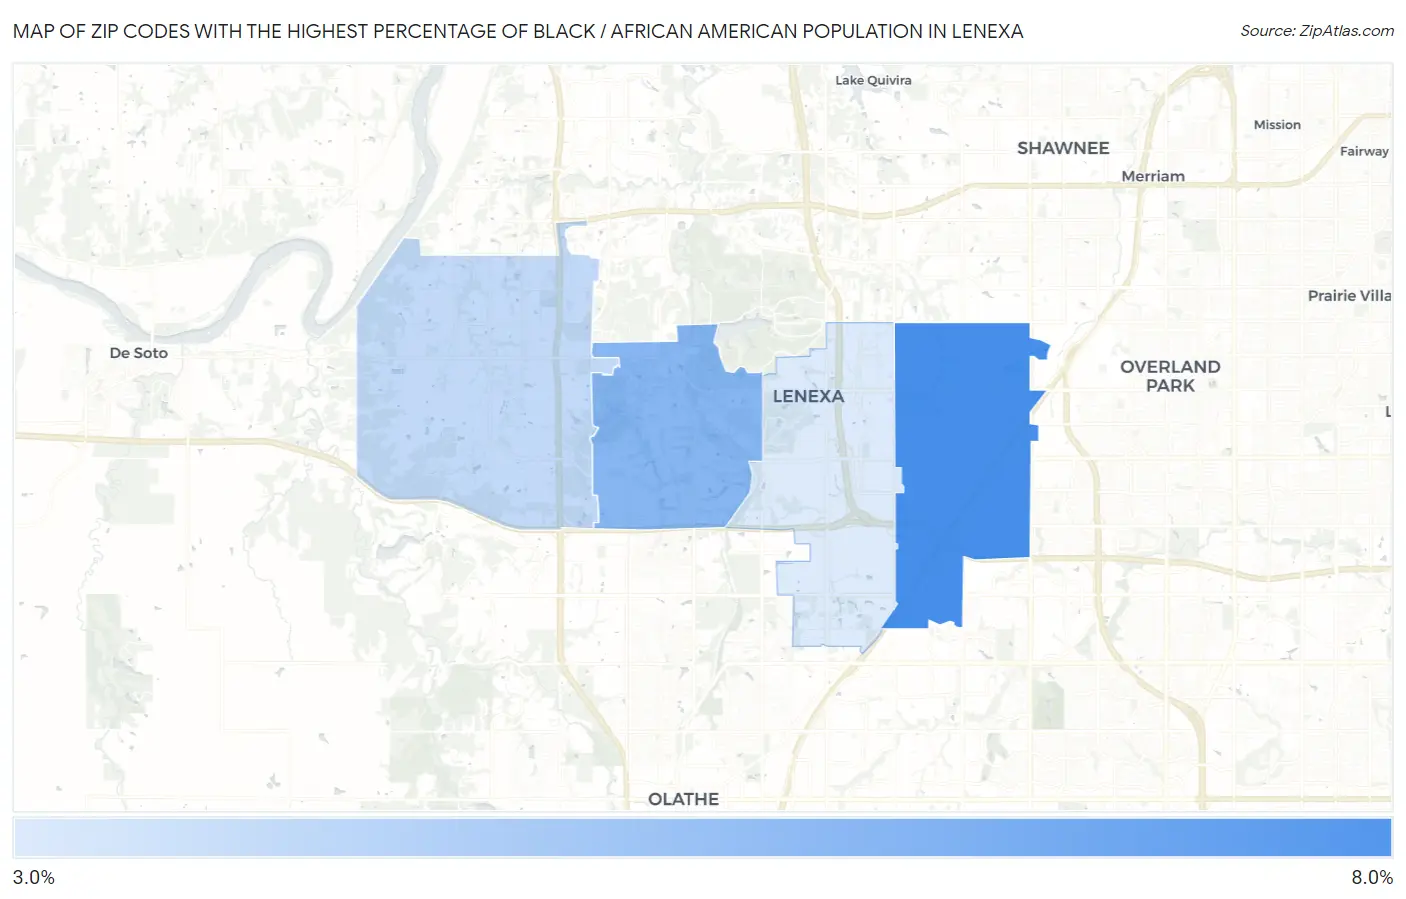
Map of Zip Codes with the Highest Percentage of Black / African American Population in Lenexa
3.1%
8.0%
Zip Codes with the Highest Percentage of Black / African American Population in Lenexa, KS
| Zip Code | Black / African American | vs State | vs National | |
| 1. | 66215 | 8.0% | 5.6%(+2.42)#45 | 12.5%(-4.48)#7,545 |
| 2. | 66220 | 5.9% | 5.6%(+0.316)#68 | 12.5%(-6.58)#8,831 |
| 3. | 66227 | 4.0% | 5.6%(-1.60)#95 | 12.5%(-8.50)#10,523 |
| 4. | 66219 | 3.1% | 5.6%(-2.45)#111 | 12.5%(-9.35)#11,615 |
1
Common Questions
What are the Top 3 Zip Codes with the Highest Percentage of Black / African American Population in Lenexa, KS?
Top 3 Zip Codes with the Highest Percentage of Black / African American Population in Lenexa, KS are:
What zip code has the Highest Percentage of Black / African American Population in Lenexa, KS?
66215 has the Highest Percentage of Black / African American Population in Lenexa, KS with 8.0%.
What is the Percentage of Black / African American Population in Lenexa, KS?
Percentage of Black / African American Population in Lenexa is 6.9%.
What is the Percentage of Black / African American Population in Kansas?
Percentage of Black / African American Population in Kansas is 5.6%.
What is the Percentage of Black / African American Population in the United States?
Percentage of Black / African American Population in the United States is 12.5%.