Zip Codes with the Highest Percentage of Population Employed in Sales & Related in Leawood, KS
RELATED REPORTS & OPTIONS
Sales & Related
Leawood
Compare Zip Codes
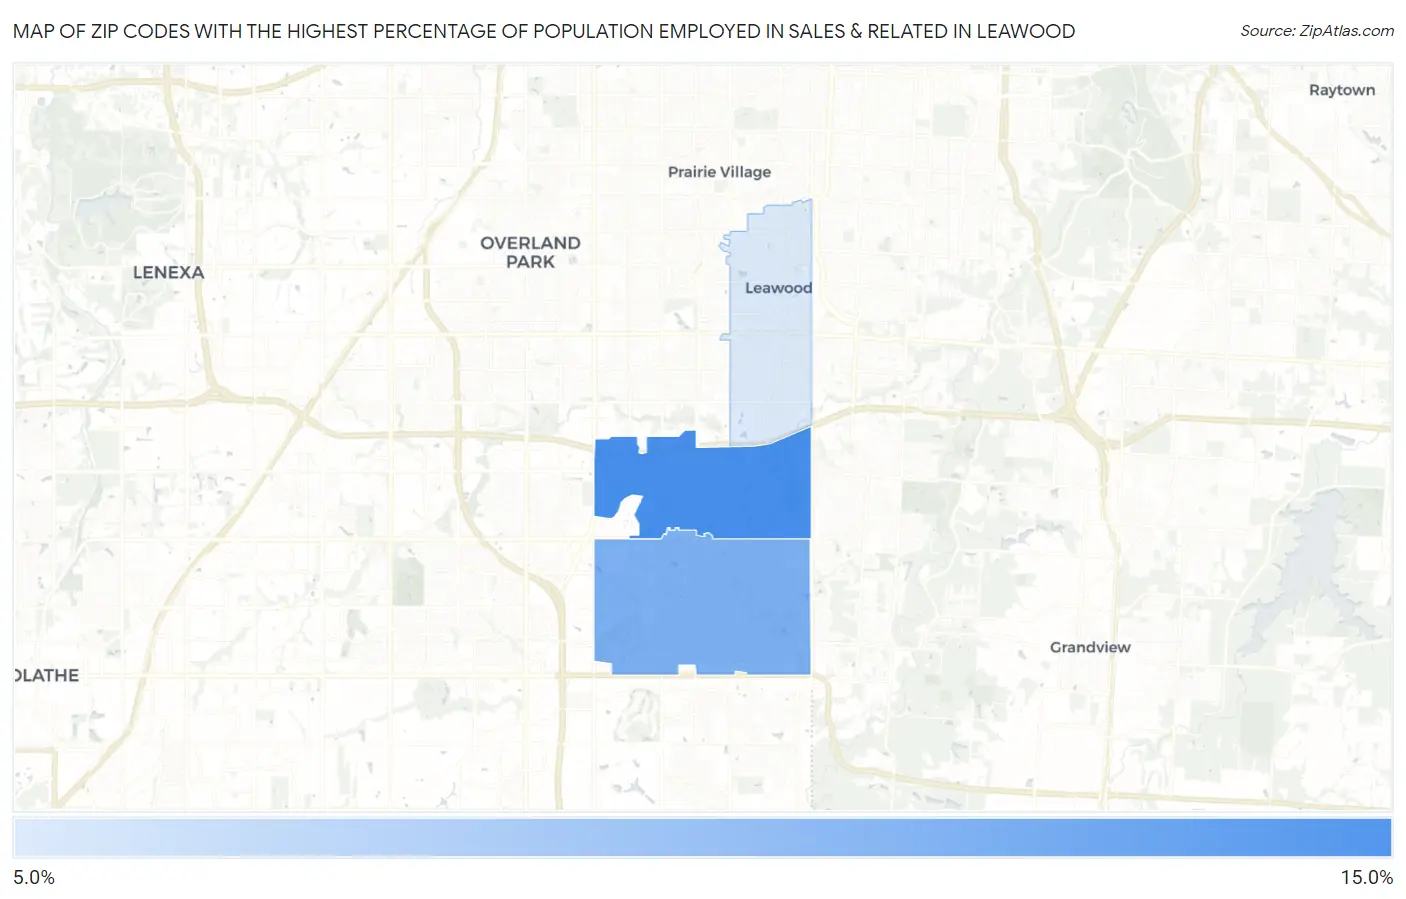
Map of Zip Codes with the Highest Percentage of Population Employed in Sales & Related in Leawood
12.0%
14.8%
Zip Codes with the Highest Percentage of Population Employed in Sales & Related in Leawood, KS
| Zip Code | % Employed | vs State | vs National | |
| 1. | 66211 | 14.8% | 9.3%(+5.50)#40 | 9.6%(+5.18)#2,885 |
| 2. | 66209 | 13.8% | 9.3%(+4.50)#53 | 9.6%(+4.18)#3,671 |
| 3. | 66206 | 12.0% | 9.3%(+2.74)#94 | 9.6%(+2.42)#6,025 |
1
Common Questions
What are the Top Zip Codes with the Highest Percentage of Population Employed in Sales & Related in Leawood, KS?
Top Zip Codes with the Highest Percentage of Population Employed in Sales & Related in Leawood, KS are:
What zip code has the Highest Percentage of Population Employed in Sales & Related in Leawood, KS?
66211 has the Highest Percentage of Population Employed in Sales & Related in Leawood, KS with 14.8%.
What is the Percentage of Population Employed in Sales & Related in Leawood, KS?
Percentage of Population Employed in Sales & Related in Leawood is 12.4%.
What is the Percentage of Population Employed in Sales & Related in Kansas?
Percentage of Population Employed in Sales & Related in Kansas is 9.3%.
What is the Percentage of Population Employed in Sales & Related in the United States?
Percentage of Population Employed in Sales & Related in the United States is 9.6%.