Zip Codes with the Highest Percentage of Population Employed in Farming, Fishing & Forestry in Kansas City, KS
RELATED REPORTS & OPTIONS
Farming, Fishing & Forestry
Kansas City
Compare Zip Codes
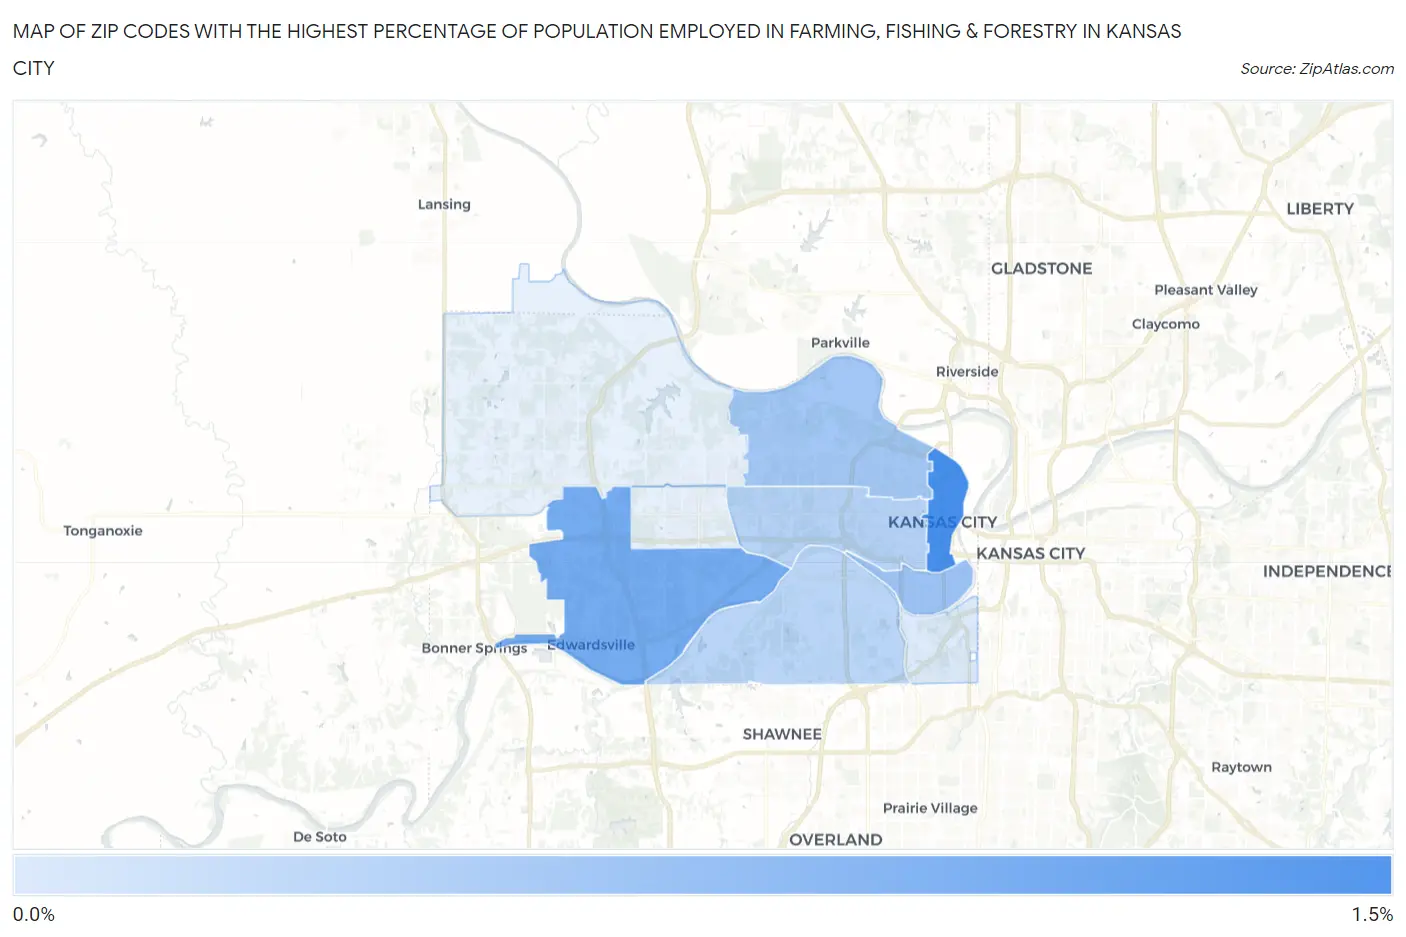
Map of Zip Codes with the Highest Percentage of Population Employed in Farming, Fishing & Forestry in Kansas City
0.0%
1.5%
Zip Codes with the Highest Percentage of Population Employed in Farming, Fishing & Forestry in Kansas City, KS
| Zip Code | % Employed | vs State | vs National | |
| 1. | 66101 | 1.4% | 0.91%(+0.525)#285 | 0.61%(+0.829)#8,084 |
| 2. | 66111 | 1.0% | 0.91%(+0.109)#322 | 0.61%(+0.414)#9,650 |
| 3. | 66105 | 0.69% | 0.91%(-0.221)#358 | 0.61%(+0.083)#11,450 |
| 4. | 66104 | 0.59% | 0.91%(-0.317)#370 | 0.61%(-0.012)#12,081 |
| 5. | 66102 | 0.44% | 0.91%(-0.473)#393 | 0.61%(-0.169)#13,416 |
| 6. | 66106 | 0.39% | 0.91%(-0.519)#400 | 0.61%(-0.214)#13,841 |
| 7. | 66103 | 0.079% | 0.91%(-0.831)#446 | 0.61%(-0.527)#18,141 |
1
Common Questions
What are the Top 5 Zip Codes with the Highest Percentage of Population Employed in Farming, Fishing & Forestry in Kansas City, KS?
Top 5 Zip Codes with the Highest Percentage of Population Employed in Farming, Fishing & Forestry in Kansas City, KS are:
What zip code has the Highest Percentage of Population Employed in Farming, Fishing & Forestry in Kansas City, KS?
66101 has the Highest Percentage of Population Employed in Farming, Fishing & Forestry in Kansas City, KS with 1.4%.
What is the Percentage of Population Employed in Farming, Fishing & Forestry in Kansas City, KS?
Percentage of Population Employed in Farming, Fishing & Forestry in Kansas City is 0.35%.
What is the Percentage of Population Employed in Farming, Fishing & Forestry in Kansas?
Percentage of Population Employed in Farming, Fishing & Forestry in Kansas is 0.91%.
What is the Percentage of Population Employed in Farming, Fishing & Forestry in the United States?
Percentage of Population Employed in Farming, Fishing & Forestry in the United States is 0.61%.