Zip Codes with the Highest Percentage of Population Employed in Farming, Fishing & Forestry in Hutchinson, KS
RELATED REPORTS & OPTIONS
Farming, Fishing & Forestry
Hutchinson
Compare Zip Codes
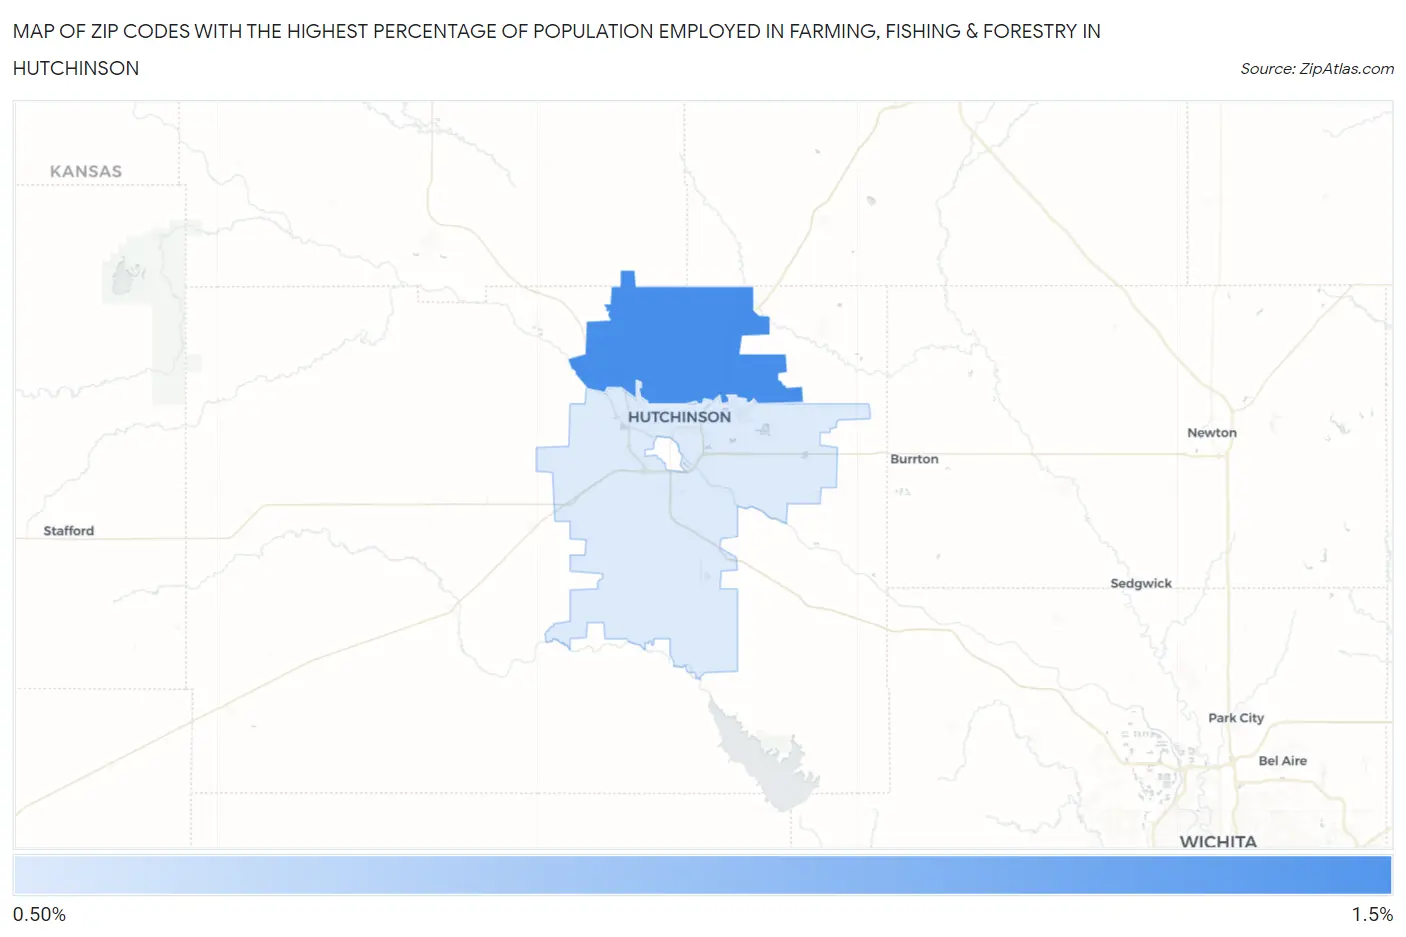
Map of Zip Codes with the Highest Percentage of Population Employed in Farming, Fishing & Forestry in Hutchinson
0.0%
1.5%
Zip Codes with the Highest Percentage of Population Employed in Farming, Fishing & Forestry in Hutchinson, KS
| Zip Code | % Employed | vs State | vs National | |
| 1. | 67502 | 1.0% | 0.91%(+0.112)#320 | 0.61%(+0.417)#9,634 |
| 2. | 67501 | 0.88% | 0.91%(-0.030)#340 | 0.61%(+0.275)#10,330 |
1
Common Questions
What are the Top Zip Codes with the Highest Percentage of Population Employed in Farming, Fishing & Forestry in Hutchinson, KS?
Top Zip Codes with the Highest Percentage of Population Employed in Farming, Fishing & Forestry in Hutchinson, KS are:
What zip code has the Highest Percentage of Population Employed in Farming, Fishing & Forestry in Hutchinson, KS?
67502 has the Highest Percentage of Population Employed in Farming, Fishing & Forestry in Hutchinson, KS with 1.0%.
What is the Percentage of Population Employed in Farming, Fishing & Forestry in Hutchinson, KS?
Percentage of Population Employed in Farming, Fishing & Forestry in Hutchinson is 0.90%.
What is the Percentage of Population Employed in Farming, Fishing & Forestry in Kansas?
Percentage of Population Employed in Farming, Fishing & Forestry in Kansas is 0.91%.
What is the Percentage of Population Employed in Farming, Fishing & Forestry in the United States?
Percentage of Population Employed in Farming, Fishing & Forestry in the United States is 0.61%.