Zip Codes with the Highest Percentage of Population Employed in Construction & Extraction in Indiana
RELATED REPORTS & OPTIONS
Construction & Extraction
Indiana
Compare Zip Codes
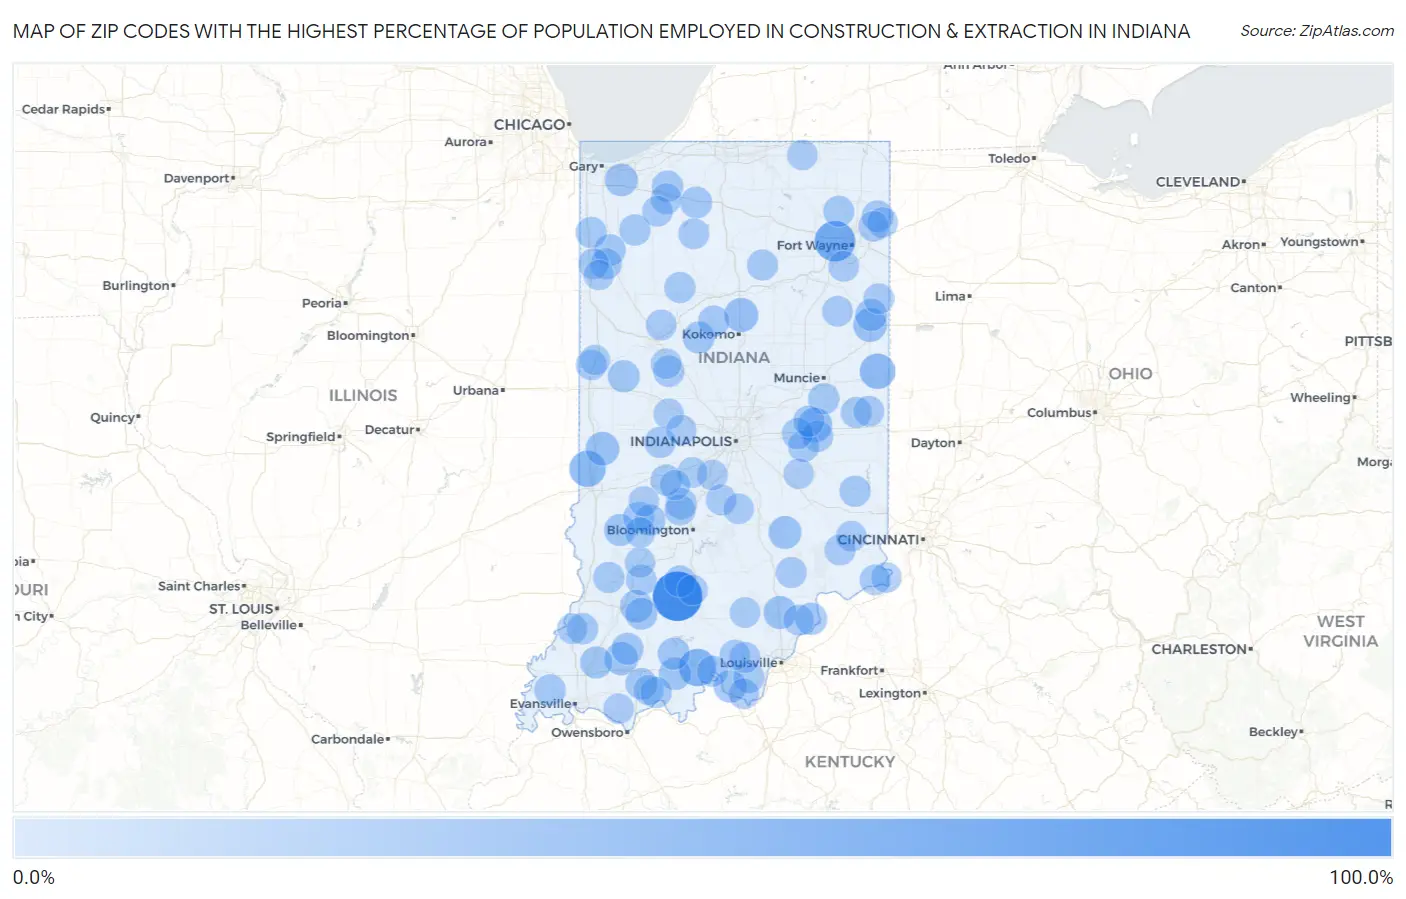
Map of Zip Codes with the Highest Percentage of Population Employed in Construction & Extraction in Indiana
0.0%
100.0%
Zip Codes with the Highest Percentage of Population Employed in Construction & Extraction in Indiana
| Zip Code | % Employed | vs State | vs National | |
| 1. | 47437 | 100.0% | 4.7%(+95.3)#1 | 5.0%(+95.0)#20 |
| 2. | 46704 | 57.9% | 4.7%(+53.2)#2 | 5.0%(+52.9)#90 |
| 3. | 47174 | 41.9% | 4.7%(+37.2)#3 | 5.0%(+36.9)#193 |
| 4. | 47863 | 37.0% | 4.7%(+32.3)#4 | 5.0%(+32.0)#263 |
| 5. | 47382 | 33.3% | 4.7%(+28.6)#5 | 5.0%(+28.3)#326 |
| 6. | 47344 | 28.8% | 4.7%(+24.1)#6 | 5.0%(+23.9)#432 |
| 7. | 46959 | 26.9% | 4.7%(+22.1)#7 | 5.0%(+21.9)#519 |
| 8. | 47326 | 25.3% | 4.7%(+20.6)#8 | 5.0%(+20.3)#575 |
| 9. | 47860 | 25.3% | 4.7%(+20.6)#9 | 5.0%(+20.3)#576 |
| 10. | 47585 | 23.7% | 4.7%(+19.0)#10 | 5.0%(+18.7)#670 |
| 11. | 47177 | 22.6% | 4.7%(+17.9)#11 | 5.0%(+17.6)#746 |
| 12. | 47236 | 22.2% | 4.7%(+17.5)#12 | 5.0%(+17.2)#785 |
| 13. | 46393 | 21.0% | 4.7%(+16.3)#13 | 5.0%(+16.0)#896 |
| 14. | 47110 | 20.3% | 4.7%(+15.6)#14 | 5.0%(+15.3)#952 |
| 15. | 47558 | 19.8% | 4.7%(+15.1)#15 | 5.0%(+14.8)#1,021 |
| 16. | 47515 | 19.4% | 4.7%(+14.7)#16 | 5.0%(+14.5)#1,070 |
| 17. | 46740 | 18.4% | 4.7%(+13.7)#17 | 5.0%(+13.4)#1,236 |
| 18. | 47654 | 18.2% | 4.7%(+13.5)#18 | 5.0%(+13.2)#1,269 |
| 19. | 47969 | 18.0% | 4.7%(+13.3)#19 | 5.0%(+13.0)#1,290 |
| 20. | 47438 | 18.0% | 4.7%(+13.3)#20 | 5.0%(+13.0)#1,297 |
| 21. | 47162 | 17.8% | 4.7%(+13.1)#21 | 5.0%(+12.8)#1,333 |
| 22. | 47513 | 17.7% | 4.7%(+13.0)#22 | 5.0%(+12.7)#1,343 |
| 23. | 47590 | 17.5% | 4.7%(+12.8)#23 | 5.0%(+12.5)#1,388 |
| 24. | 47519 | 17.4% | 4.7%(+12.7)#24 | 5.0%(+12.4)#1,403 |
| 25. | 46920 | 16.7% | 4.7%(+12.0)#25 | 5.0%(+11.7)#1,538 |
| 26. | 46531 | 16.5% | 4.7%(+11.8)#26 | 5.0%(+11.5)#1,587 |
| 27. | 47943 | 16.1% | 4.7%(+11.4)#27 | 5.0%(+11.1)#1,689 |
| 28. | 47470 | 15.9% | 4.7%(+11.2)#28 | 5.0%(+10.9)#1,738 |
| 29. | 46788 | 15.8% | 4.7%(+11.1)#29 | 5.0%(+10.8)#1,761 |
| 30. | 47552 | 15.3% | 4.7%(+10.6)#30 | 5.0%(+10.3)#1,920 |
| 31. | 47638 | 15.3% | 4.7%(+10.5)#31 | 5.0%(+10.3)#1,930 |
| 32. | 47427 | 15.0% | 4.7%(+10.3)#32 | 5.0%(+10.0)#2,011 |
| 33. | 46998 | 14.9% | 4.7%(+10.2)#33 | 5.0%(+9.93)#2,055 |
| 34. | 46382 | 14.8% | 4.7%(+10.1)#34 | 5.0%(+9.84)#2,093 |
| 35. | 47337 | 14.8% | 4.7%(+10.1)#35 | 5.0%(+9.78)#2,117 |
| 36. | 46392 | 14.7% | 4.7%(+10.0)#36 | 5.0%(+9.75)#2,137 |
| 37. | 47386 | 14.7% | 4.7%(+10.0)#37 | 5.0%(+9.75)#2,138 |
| 38. | 47930 | 14.7% | 4.7%(+10.0)#38 | 5.0%(+9.72)#2,153 |
| 39. | 47433 | 14.6% | 4.7%(+9.88)#39 | 5.0%(+9.59)#2,206 |
| 40. | 46115 | 14.6% | 4.7%(+9.86)#40 | 5.0%(+9.57)#2,212 |
| 41. | 47640 | 14.6% | 4.7%(+9.86)#41 | 5.0%(+9.57)#2,213 |
| 42. | 46117 | 14.5% | 4.7%(+9.80)#42 | 5.0%(+9.51)#2,240 |
| 43. | 47137 | 14.4% | 4.7%(+9.66)#43 | 5.0%(+9.38)#2,287 |
| 44. | 46379 | 14.3% | 4.7%(+9.58)#44 | 5.0%(+9.29)#2,321 |
| 45. | 47964 | 14.3% | 4.7%(+9.58)#45 | 5.0%(+9.29)#2,331 |
| 46. | 46105 | 14.2% | 4.7%(+9.50)#46 | 5.0%(+9.21)#2,363 |
| 47. | 47950 | 14.1% | 4.7%(+9.43)#47 | 5.0%(+9.14)#2,388 |
| 48. | 47531 | 14.1% | 4.7%(+9.37)#48 | 5.0%(+9.08)#2,426 |
| 49. | 47160 | 13.9% | 4.7%(+9.18)#49 | 5.0%(+8.89)#2,512 |
| 50. | 47351 | 13.8% | 4.7%(+9.13)#50 | 5.0%(+8.85)#2,533 |
| 51. | 47030 | 13.7% | 4.7%(+9.02)#51 | 5.0%(+8.73)#2,577 |
| 52. | 47528 | 13.7% | 4.7%(+8.96)#52 | 5.0%(+8.67)#2,625 |
| 53. | 46120 | 13.6% | 4.7%(+8.88)#53 | 5.0%(+8.59)#2,662 |
| 54. | 46974 | 13.5% | 4.7%(+8.77)#54 | 5.0%(+8.48)#2,715 |
| 55. | 47431 | 13.4% | 4.7%(+8.71)#55 | 5.0%(+8.42)#2,747 |
| 56. | 47339 | 13.3% | 4.7%(+8.55)#56 | 5.0%(+8.27)#2,811 |
| 57. | 46763 | 13.2% | 4.7%(+8.54)#57 | 5.0%(+8.25)#2,820 |
| 58. | 47227 | 12.7% | 4.7%(+7.97)#58 | 5.0%(+7.69)#3,130 |
| 59. | 47114 | 12.5% | 4.7%(+7.79)#59 | 5.0%(+7.51)#3,256 |
| 60. | 47393 | 12.5% | 4.7%(+7.78)#60 | 5.0%(+7.49)#3,279 |
| 61. | 46340 | 12.3% | 4.7%(+7.63)#61 | 5.0%(+7.34)#3,379 |
| 62. | 47042 | 12.3% | 4.7%(+7.62)#62 | 5.0%(+7.33)#3,382 |
| 63. | 47031 | 12.1% | 4.7%(+7.39)#63 | 5.0%(+7.10)#3,529 |
| 64. | 46798 | 12.1% | 4.7%(+7.37)#64 | 5.0%(+7.08)#3,542 |
| 65. | 46348 | 12.1% | 4.7%(+7.35)#65 | 5.0%(+7.06)#3,552 |
| 66. | 46743 | 12.1% | 4.7%(+7.35)#66 | 5.0%(+7.06)#3,553 |
| 67. | 46781 | 12.0% | 4.7%(+7.32)#67 | 5.0%(+7.03)#3,572 |
| 68. | 47464 | 12.0% | 4.7%(+7.29)#68 | 5.0%(+7.01)#3,587 |
| 69. | 46772 | 12.0% | 4.7%(+7.26)#69 | 5.0%(+6.97)#3,611 |
| 70. | 47963 | 11.9% | 4.7%(+7.24)#70 | 5.0%(+6.96)#3,622 |
| 71. | 47141 | 11.9% | 4.7%(+7.21)#71 | 5.0%(+6.92)#3,640 |
| 72. | 46960 | 11.9% | 4.7%(+7.17)#72 | 5.0%(+6.88)#3,665 |
| 73. | 47562 | 11.8% | 4.7%(+7.10)#73 | 5.0%(+6.81)#3,715 |
| 74. | 47920 | 11.7% | 4.7%(+6.99)#74 | 5.0%(+6.70)#3,812 |
| 75. | 46160 | 11.7% | 4.7%(+6.98)#75 | 5.0%(+6.70)#3,815 |
| 76. | 47991 | 11.6% | 4.7%(+6.85)#76 | 5.0%(+6.56)#3,920 |
| 77. | 46741 | 11.6% | 4.7%(+6.85)#77 | 5.0%(+6.56)#3,921 |
| 78. | 46164 | 11.5% | 4.7%(+6.80)#78 | 5.0%(+6.51)#3,955 |
| 79. | 47020 | 11.4% | 4.7%(+6.74)#79 | 5.0%(+6.45)#4,005 |
| 80. | 47166 | 11.2% | 4.7%(+6.54)#80 | 5.0%(+6.25)#4,150 |
| 81. | 47135 | 11.2% | 4.7%(+6.54)#81 | 5.0%(+6.25)#4,153 |
| 82. | 46111 | 11.2% | 4.7%(+6.46)#82 | 5.0%(+6.17)#4,232 |
| 83. | 47167 | 11.0% | 4.7%(+6.33)#83 | 5.0%(+6.04)#4,340 |
| 84. | 47968 | 11.0% | 4.7%(+6.31)#84 | 5.0%(+6.02)#4,355 |
| 85. | 47524 | 11.0% | 4.7%(+6.27)#85 | 5.0%(+5.98)#4,393 |
| 86. | 46157 | 10.9% | 4.7%(+6.18)#86 | 5.0%(+5.89)#4,482 |
| 87. | 47983 | 10.9% | 4.7%(+6.16)#87 | 5.0%(+5.88)#4,503 |
| 88. | 47446 | 10.9% | 4.7%(+6.15)#88 | 5.0%(+5.86)#4,517 |
| 89. | 47449 | 10.7% | 4.7%(+6.01)#89 | 5.0%(+5.72)#4,639 |
| 90. | 47038 | 10.7% | 4.7%(+6.00)#90 | 5.0%(+5.71)#4,652 |
| 91. | 47550 | 10.7% | 4.7%(+5.96)#91 | 5.0%(+5.67)#4,683 |
| 92. | 46150 | 10.5% | 4.7%(+5.78)#92 | 5.0%(+5.50)#4,864 |
| 93. | 47456 | 10.5% | 4.7%(+5.77)#93 | 5.0%(+5.48)#4,891 |
| 94. | 47634 | 10.4% | 4.7%(+5.74)#94 | 5.0%(+5.45)#4,928 |
| 95. | 47922 | 10.4% | 4.7%(+5.73)#95 | 5.0%(+5.44)#4,935 |
| 96. | 46565 | 10.4% | 4.7%(+5.66)#96 | 5.0%(+5.38)#4,999 |
| 97. | 47833 | 10.4% | 4.7%(+5.66)#97 | 5.0%(+5.37)#5,008 |
| 98. | 47993 | 10.4% | 4.7%(+5.65)#98 | 5.0%(+5.36)#5,020 |
| 99. | 46165 | 10.3% | 4.7%(+5.63)#99 | 5.0%(+5.34)#5,050 |
| 100. | 47471 | 10.3% | 4.7%(+5.61)#100 | 5.0%(+5.32)#5,065 |
Common Questions
What are the Top 10 Zip Codes with the Highest Percentage of Population Employed in Construction & Extraction in Indiana?
Top 10 Zip Codes with the Highest Percentage of Population Employed in Construction & Extraction in Indiana are:
What zip code has the Highest Percentage of Population Employed in Construction & Extraction in Indiana?
47437 has the Highest Percentage of Population Employed in Construction & Extraction in Indiana with 100.0%.
What is the Percentage of Population Employed in Construction & Extraction in the State of Indiana?
Percentage of Population Employed in Construction & Extraction in Indiana is 4.7%.
What is the Percentage of Population Employed in Construction & Extraction in the United States?
Percentage of Population Employed in Construction & Extraction in the United States is 5.0%.