Zip Codes with the Highest Percentage of Population Employed in Agriculture, Fishing & Hunting in Terre Haute, IN
RELATED REPORTS & OPTIONS
Agriculture, Fishing & Hunting
Terre Haute
Compare Zip Codes
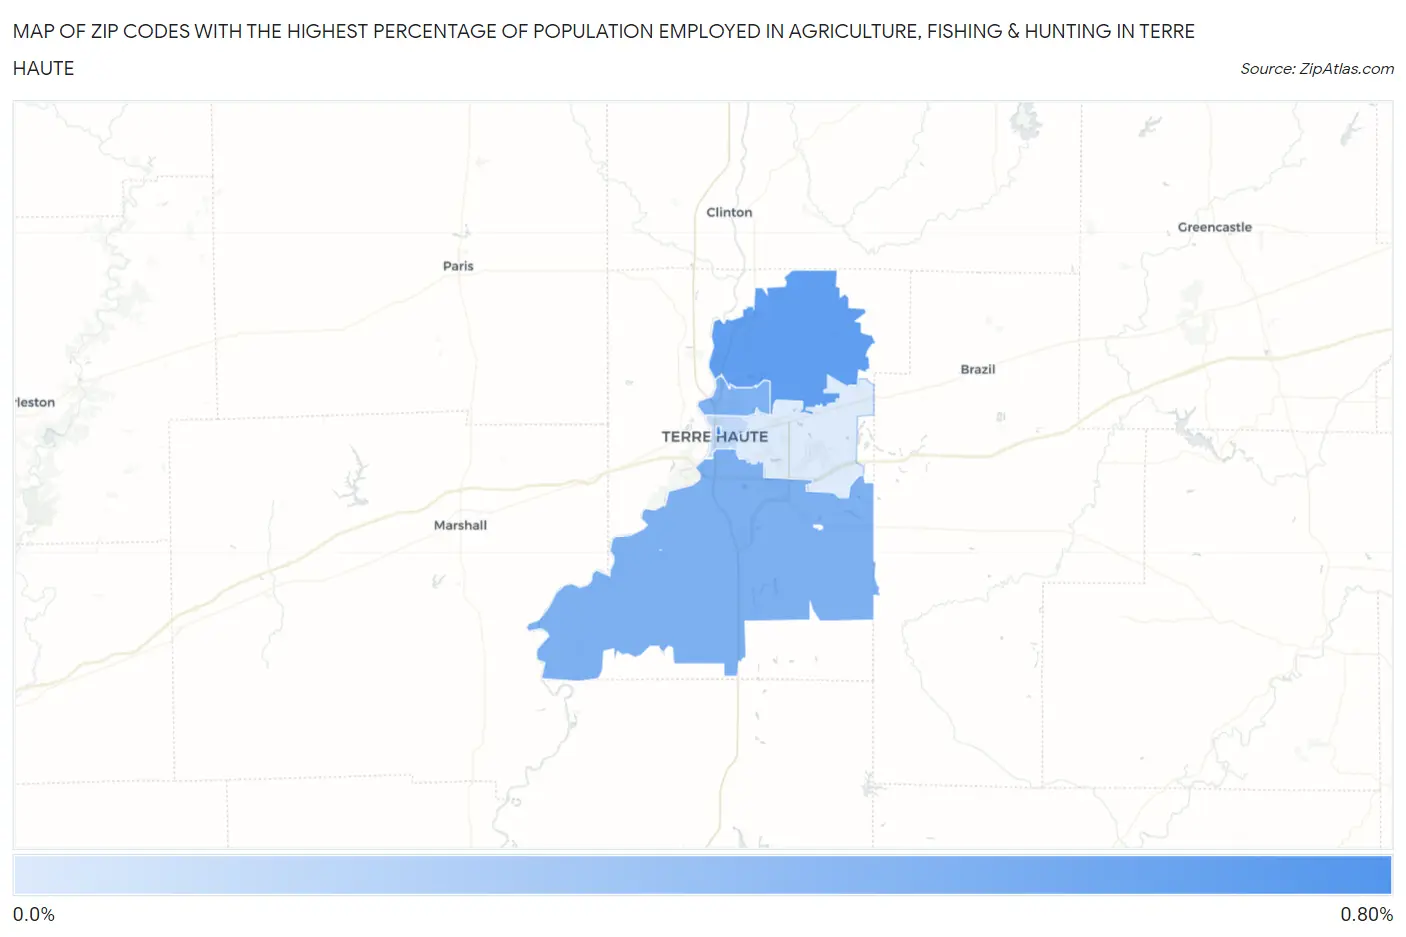
Map of Zip Codes with the Highest Percentage of Population Employed in Agriculture, Fishing & Hunting in Terre Haute
0.0%
0.80%
Zip Codes with the Highest Percentage of Population Employed in Agriculture, Fishing & Hunting in Terre Haute, IN
| Zip Code | % Employed | vs State | vs National | |
| 1. | 47809 | 0.78% | 1.1%(-0.277)#417 | 1.2%(-0.420)#17,363 |
| 2. | 47805 | 0.68% | 1.1%(-0.382)#438 | 1.2%(-0.524)#17,989 |
| 3. | 47802 | 0.56% | 1.1%(-0.502)#459 | 1.2%(-0.644)#18,811 |
| 4. | 47804 | 0.54% | 1.1%(-0.512)#461 | 1.2%(-0.655)#18,896 |
| 5. | 47807 | 0.27% | 1.1%(-0.785)#526 | 1.2%(-0.928)#21,520 |
| 6. | 47803 | 0.15% | 1.1%(-0.904)#563 | 1.2%(-1.05)#22,971 |
1
Common Questions
What are the Top 5 Zip Codes with the Highest Percentage of Population Employed in Agriculture, Fishing & Hunting in Terre Haute, IN?
Top 5 Zip Codes with the Highest Percentage of Population Employed in Agriculture, Fishing & Hunting in Terre Haute, IN are:
What zip code has the Highest Percentage of Population Employed in Agriculture, Fishing & Hunting in Terre Haute, IN?
47809 has the Highest Percentage of Population Employed in Agriculture, Fishing & Hunting in Terre Haute, IN with 0.78%.
What is the Percentage of Population Employed in Agriculture, Fishing & Hunting in Terre Haute, IN?
Percentage of Population Employed in Agriculture, Fishing & Hunting in Terre Haute is 0.25%.
What is the Percentage of Population Employed in Agriculture, Fishing & Hunting in Indiana?
Percentage of Population Employed in Agriculture, Fishing & Hunting in Indiana is 1.1%.
What is the Percentage of Population Employed in Agriculture, Fishing & Hunting in the United States?
Percentage of Population Employed in Agriculture, Fishing & Hunting in the United States is 1.2%.