Zip Codes with the Highest Percentage of Population Employed in Sales & Related in South Bend, IN
RELATED REPORTS & OPTIONS
Sales & Related
South Bend
Compare Zip Codes
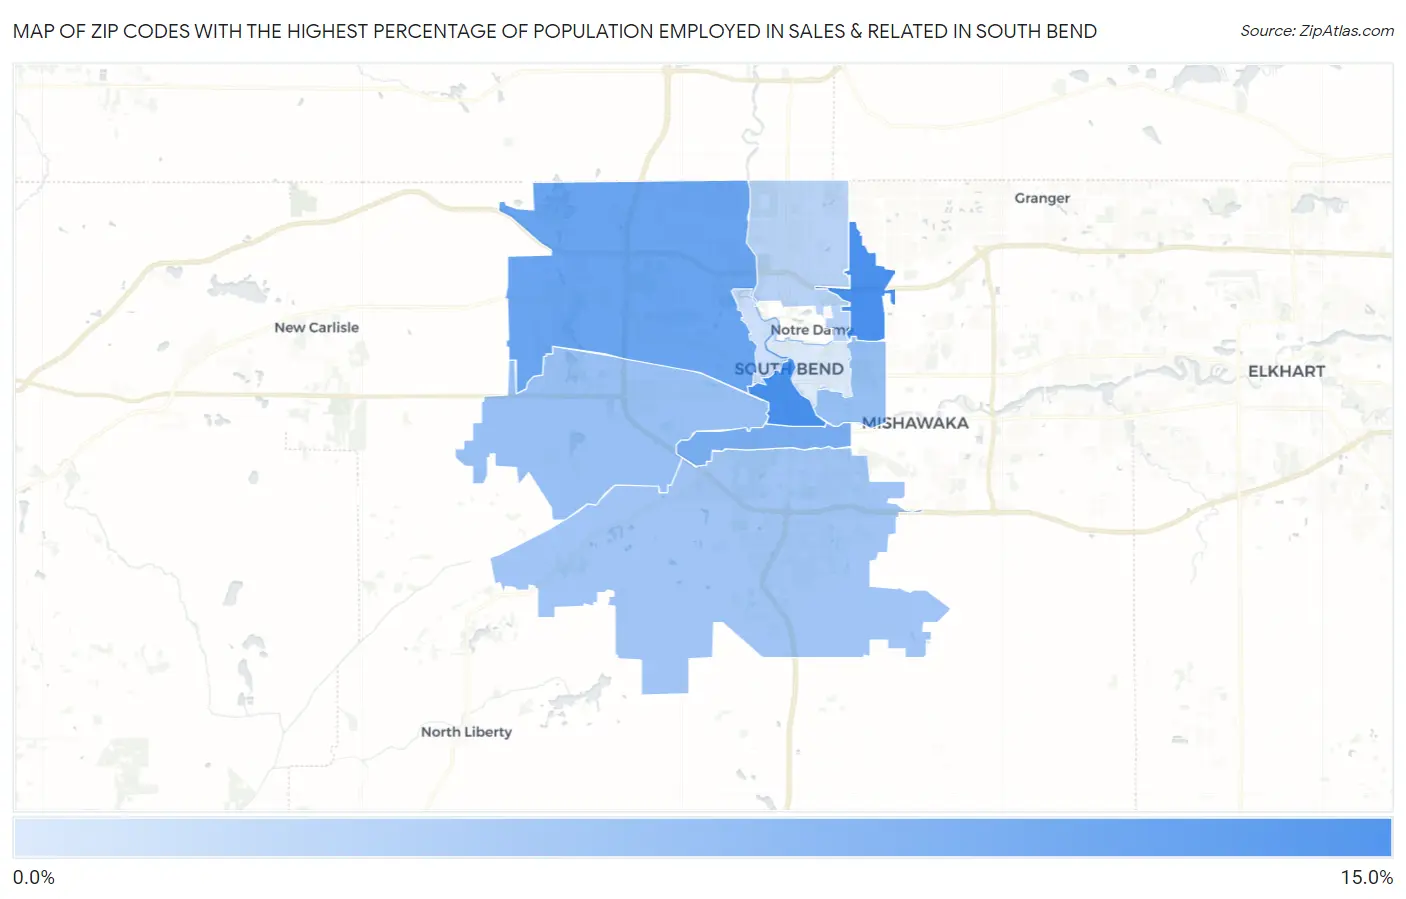
Map of Zip Codes with the Highest Percentage of Population Employed in Sales & Related in South Bend
4.9%
14.1%
Zip Codes with the Highest Percentage of Population Employed in Sales & Related in South Bend, IN
| Zip Code | % Employed | vs State | vs National | |
| 1. | 46601 | 14.1% | 8.8%(+5.24)#58 | 9.6%(+4.48)#3,411 |
| 2. | 46635 | 14.0% | 8.8%(+5.11)#59 | 9.6%(+4.36)#3,517 |
| 3. | 46628 | 11.9% | 8.8%(+3.01)#111 | 9.6%(+2.26)#6,315 |
| 4. | 46613 | 11.1% | 8.8%(+2.21)#152 | 9.6%(+1.46)#8,081 |
| 5. | 46615 | 9.2% | 8.8%(+0.397)#260 | 9.6%(-0.358)#13,654 |
| 6. | 46619 | 9.0% | 8.8%(+0.191)#276 | 9.6%(-0.563)#14,395 |
| 7. | 46614 | 8.5% | 8.8%(-0.375)#324 | 9.6%(-1.13)#16,468 |
| 8. | 46637 | 7.1% | 8.8%(-1.73)#466 | 9.6%(-2.48)#20,883 |
| 9. | 46616 | 5.9% | 8.8%(-2.90)#545 | 9.6%(-3.65)#23,774 |
| 10. | 46617 | 4.9% | 8.8%(-3.95)#596 | 9.6%(-4.71)#25,760 |
1
Common Questions
What are the Top 5 Zip Codes with the Highest Percentage of Population Employed in Sales & Related in South Bend, IN?
Top 5 Zip Codes with the Highest Percentage of Population Employed in Sales & Related in South Bend, IN are:
What zip code has the Highest Percentage of Population Employed in Sales & Related in South Bend, IN?
46601 has the Highest Percentage of Population Employed in Sales & Related in South Bend, IN with 14.1%.
What is the Percentage of Population Employed in Sales & Related in South Bend, IN?
Percentage of Population Employed in Sales & Related in South Bend is 8.2%.
What is the Percentage of Population Employed in Sales & Related in Indiana?
Percentage of Population Employed in Sales & Related in Indiana is 8.8%.
What is the Percentage of Population Employed in Sales & Related in the United States?
Percentage of Population Employed in Sales & Related in the United States is 9.6%.