Zip Codes with the Highest Percentage of Population Employed in Sales & Related in Muncie, IN
RELATED REPORTS & OPTIONS
Sales & Related
Muncie
Compare Zip Codes
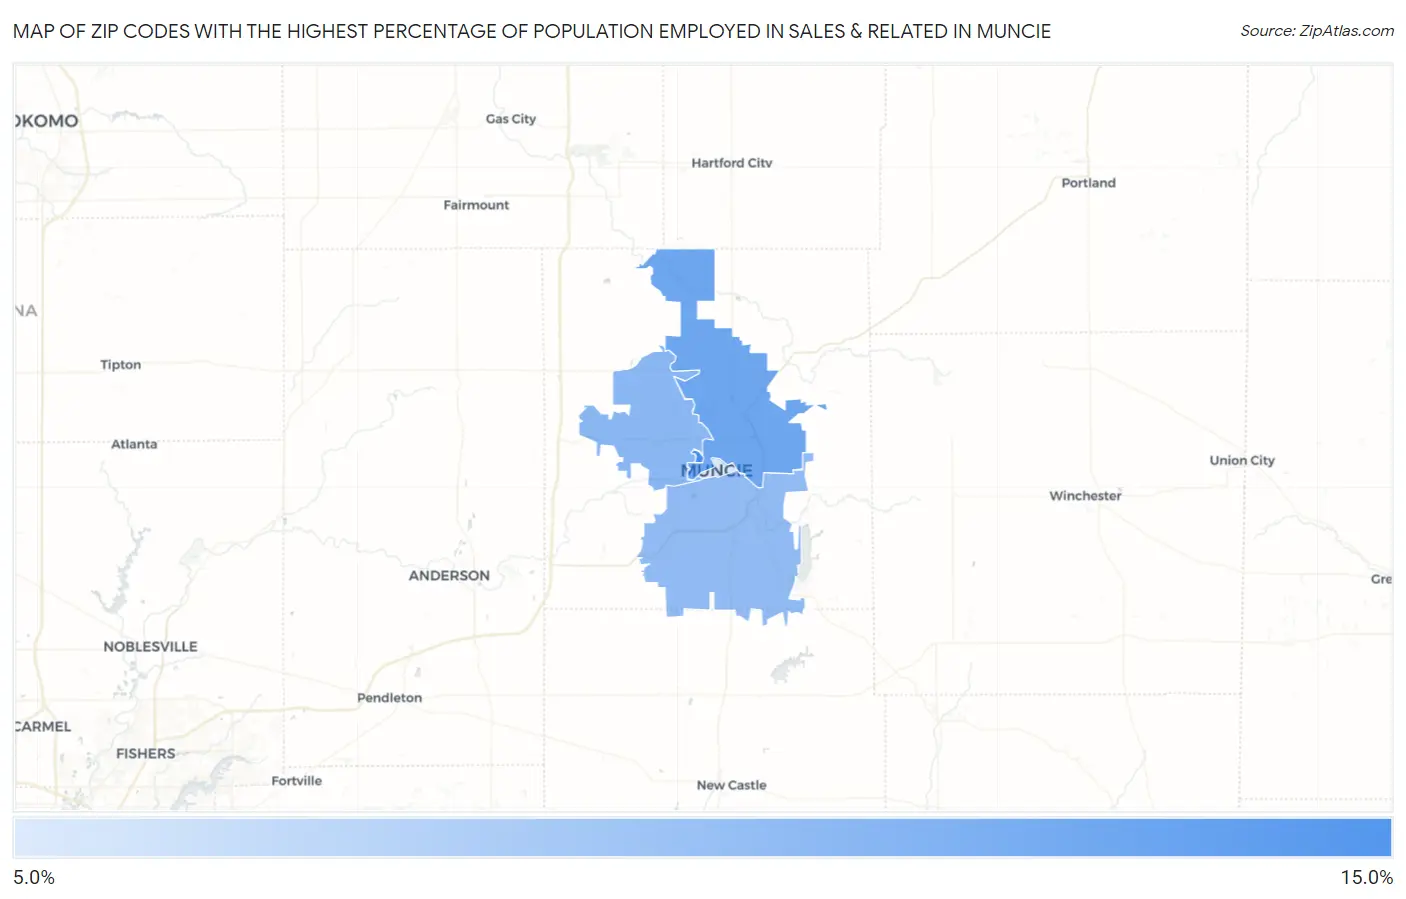
Map of Zip Codes with the Highest Percentage of Population Employed in Sales & Related in Muncie
5.9%
13.8%
Zip Codes with the Highest Percentage of Population Employed in Sales & Related in Muncie, IN
| Zip Code | % Employed | vs State | vs National | |
| 1. | 47306 | 13.8% | 8.8%(+5.01)#61 | 9.6%(+4.25)#3,598 |
| 2. | 47303 | 11.7% | 8.8%(+2.83)#118 | 9.6%(+2.08)#6,664 |
| 3. | 47304 | 10.2% | 8.8%(+1.39)#192 | 9.6%(+0.635)#10,320 |
| 4. | 47302 | 9.8% | 8.8%(+0.954)#220 | 9.6%(+0.200)#11,672 |
| 5. | 47305 | 5.9% | 8.8%(-2.99)#551 | 9.6%(-3.74)#23,973 |
1
Common Questions
What are the Top 3 Zip Codes with the Highest Percentage of Population Employed in Sales & Related in Muncie, IN?
Top 3 Zip Codes with the Highest Percentage of Population Employed in Sales & Related in Muncie, IN are:
What zip code has the Highest Percentage of Population Employed in Sales & Related in Muncie, IN?
47306 has the Highest Percentage of Population Employed in Sales & Related in Muncie, IN with 13.8%.
What is the Percentage of Population Employed in Sales & Related in Muncie, IN?
Percentage of Population Employed in Sales & Related in Muncie is 10.9%.
What is the Percentage of Population Employed in Sales & Related in Indiana?
Percentage of Population Employed in Sales & Related in Indiana is 8.8%.
What is the Percentage of Population Employed in Sales & Related in the United States?
Percentage of Population Employed in Sales & Related in the United States is 9.6%.