Zip Codes with the Highest Percentage of Population Employed in Arts, Entertainment & Recreation in Muncie, IN
RELATED REPORTS & OPTIONS
Arts, Entertainment & Recreation
Muncie
Compare Zip Codes
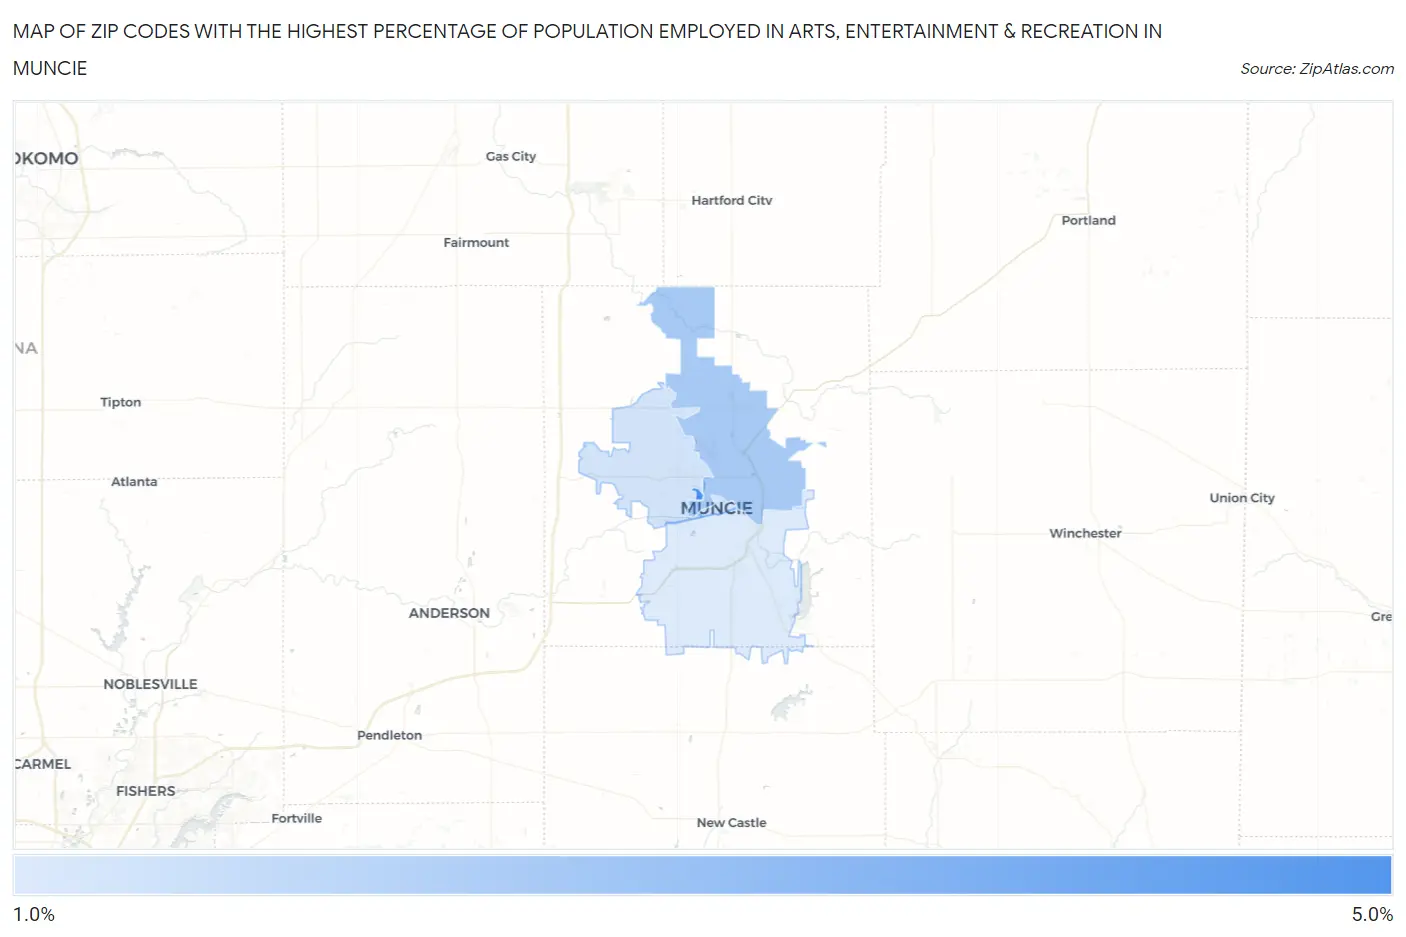
Map of Zip Codes with the Highest Percentage of Population Employed in Arts, Entertainment & Recreation in Muncie
0.0%
5.0%
Zip Codes with the Highest Percentage of Population Employed in Arts, Entertainment & Recreation in Muncie, IN
| Zip Code | % Employed | vs State | vs National | |
| 1. | 47306 | 4.8% | 1.6%(+3.13)#22 | 2.1%(+2.69)#2,464 |
| 2. | 47303 | 2.4% | 1.6%(+0.753)#118 | 2.1%(+0.311)#7,673 |
| 3. | 47304 | 1.4% | 1.6%(-0.204)#244 | 2.1%(-0.647)#13,723 |
| 4. | 47305 | 1.3% | 1.6%(-0.331)#264 | 2.1%(-0.774)#14,654 |
| 5. | 47302 | 1.2% | 1.6%(-0.486)#290 | 2.1%(-0.929)#15,850 |
1
Common Questions
What are the Top 3 Zip Codes with the Highest Percentage of Population Employed in Arts, Entertainment & Recreation in Muncie, IN?
Top 3 Zip Codes with the Highest Percentage of Population Employed in Arts, Entertainment & Recreation in Muncie, IN are:
What zip code has the Highest Percentage of Population Employed in Arts, Entertainment & Recreation in Muncie, IN?
47306 has the Highest Percentage of Population Employed in Arts, Entertainment & Recreation in Muncie, IN with 4.8%.
What is the Percentage of Population Employed in Arts, Entertainment & Recreation in Muncie, IN?
Percentage of Population Employed in Arts, Entertainment & Recreation in Muncie is 2.1%.
What is the Percentage of Population Employed in Arts, Entertainment & Recreation in Indiana?
Percentage of Population Employed in Arts, Entertainment & Recreation in Indiana is 1.6%.
What is the Percentage of Population Employed in Arts, Entertainment & Recreation in the United States?
Percentage of Population Employed in Arts, Entertainment & Recreation in the United States is 2.1%.