Zip Codes with the Highest Percentage of Population Employed in Farming, Fishing & Forestry in Muncie, IN
RELATED REPORTS & OPTIONS
Farming, Fishing & Forestry
Muncie
Compare Zip Codes
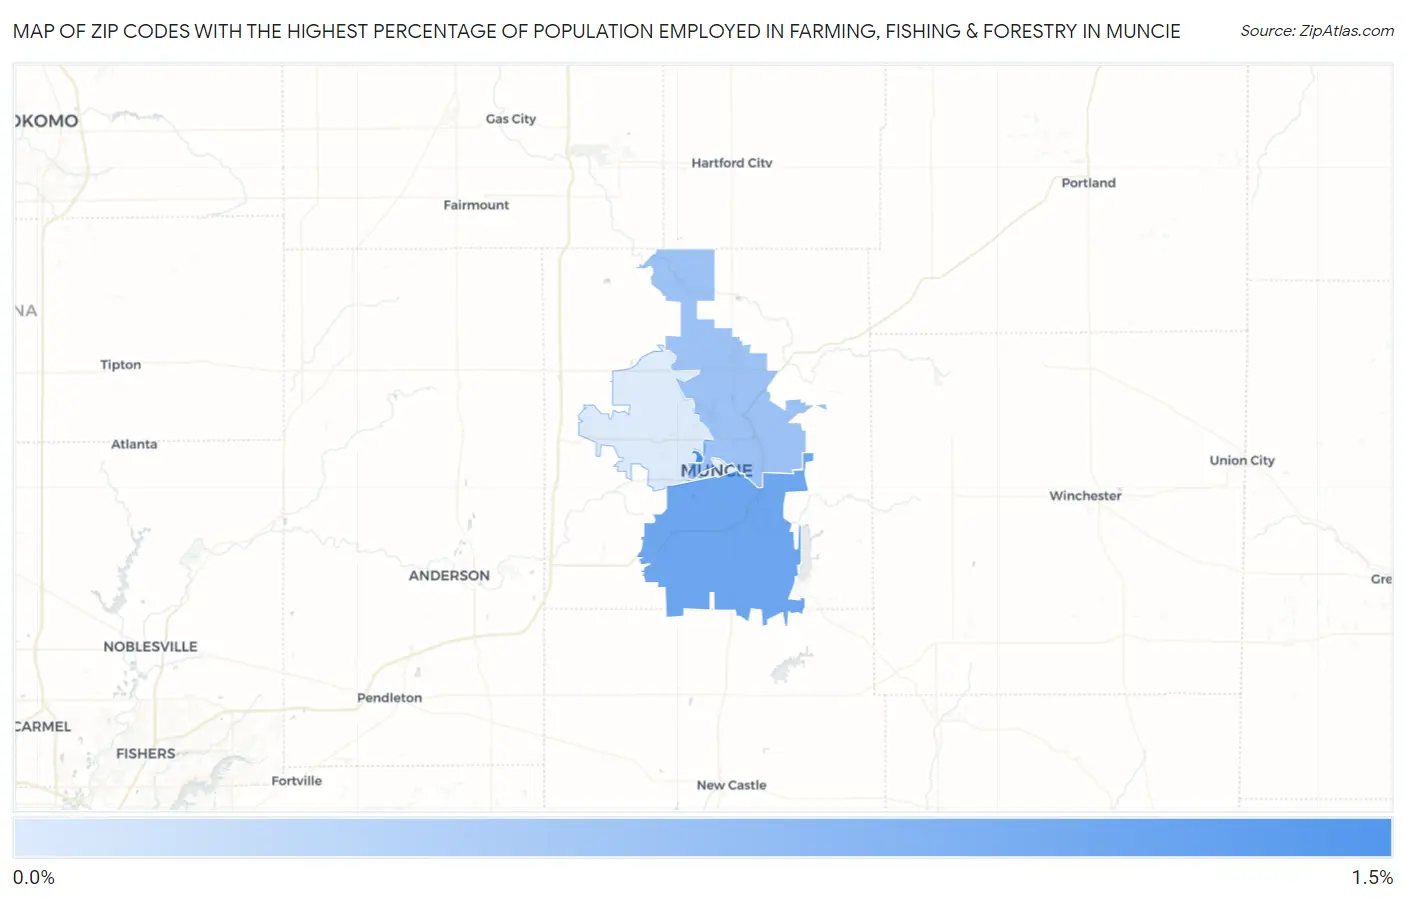
Map of Zip Codes with the Highest Percentage of Population Employed in Farming, Fishing & Forestry in Muncie
0.0%
1.5%
Zip Codes with the Highest Percentage of Population Employed in Farming, Fishing & Forestry in Muncie, IN
| Zip Code | % Employed | vs State | vs National | |
| 1. | 47306 | 1.2% | 0.39%(+0.769)#161 | 0.61%(+0.548)#9,104 |
| 2. | 47302 | 0.87% | 0.39%(+0.488)#184 | 0.61%(+0.268)#10,380 |
| 3. | 47303 | 0.54% | 0.39%(+0.150)#246 | 0.61%(-0.070)#12,554 |
| 4. | 47304 | 0.069% | 0.39%(-0.316)#394 | 0.61%(-0.536)#18,311 |
1
Common Questions
What are the Top 3 Zip Codes with the Highest Percentage of Population Employed in Farming, Fishing & Forestry in Muncie, IN?
Top 3 Zip Codes with the Highest Percentage of Population Employed in Farming, Fishing & Forestry in Muncie, IN are:
What zip code has the Highest Percentage of Population Employed in Farming, Fishing & Forestry in Muncie, IN?
47306 has the Highest Percentage of Population Employed in Farming, Fishing & Forestry in Muncie, IN with 1.2%.
What is the Percentage of Population Employed in Farming, Fishing & Forestry in Muncie, IN?
Percentage of Population Employed in Farming, Fishing & Forestry in Muncie is 0.43%.
What is the Percentage of Population Employed in Farming, Fishing & Forestry in Indiana?
Percentage of Population Employed in Farming, Fishing & Forestry in Indiana is 0.39%.
What is the Percentage of Population Employed in Farming, Fishing & Forestry in the United States?
Percentage of Population Employed in Farming, Fishing & Forestry in the United States is 0.61%.