Zip Codes with the Highest Percentage of Population Employed in Agriculture, Fishing & Hunting in Mishawaka, IN
RELATED REPORTS & OPTIONS
Agriculture, Fishing & Hunting
Mishawaka
Compare Zip Codes
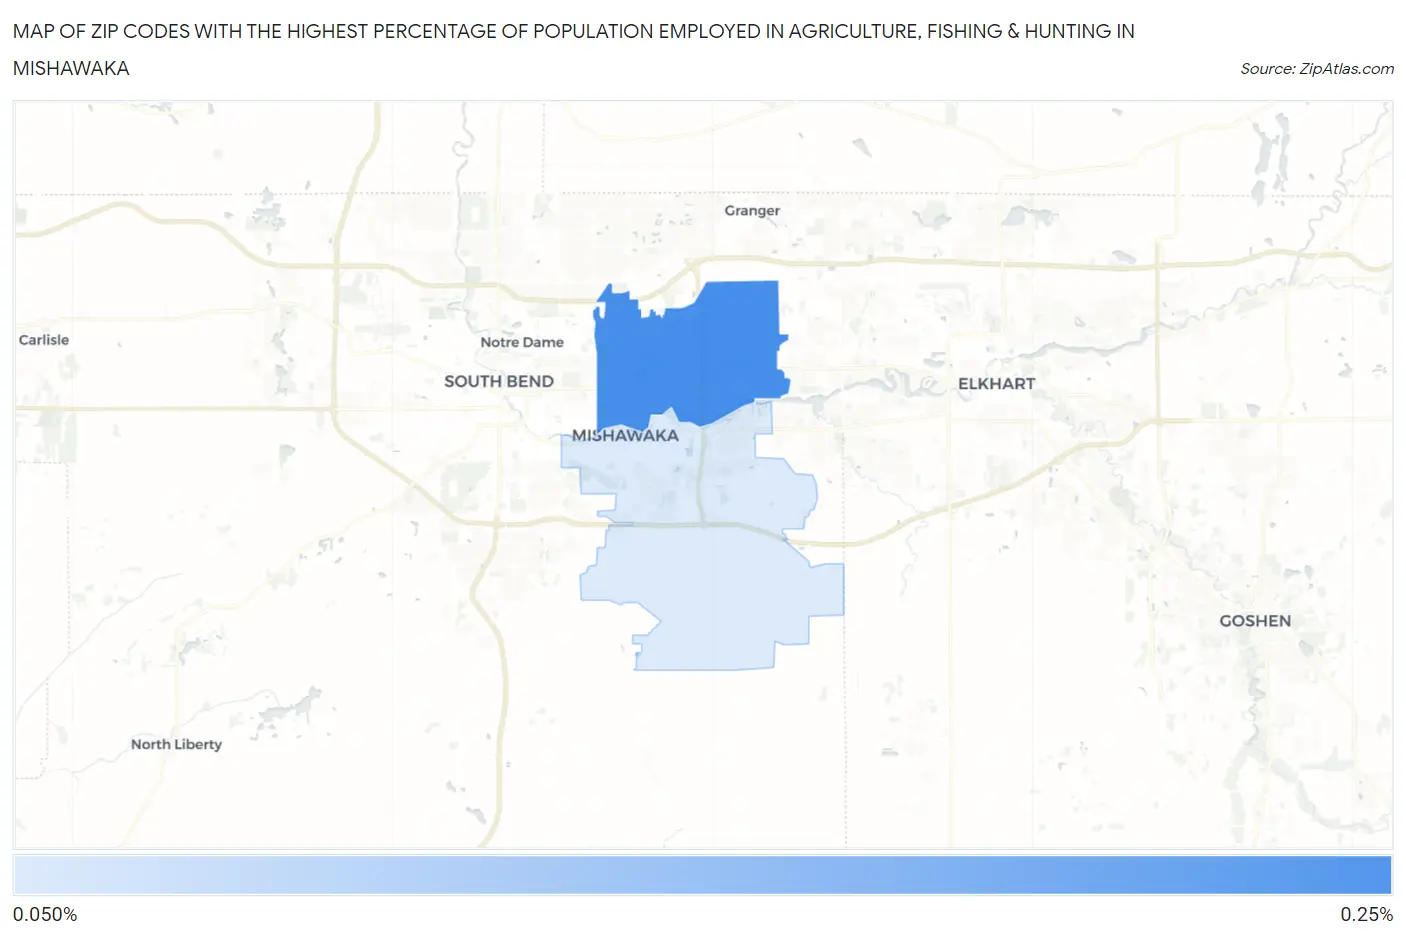
Map of Zip Codes with the Highest Percentage of Population Employed in Agriculture, Fishing & Hunting in Mishawaka
0.0%
0.25%
Zip Codes with the Highest Percentage of Population Employed in Agriculture, Fishing & Hunting in Mishawaka, IN
| Zip Code | % Employed | vs State | vs National | |
| 1. | 46545 | 0.23% | 1.1%(-0.825)#540 | 1.2%(-0.967)#21,963 |
| 2. | 46544 | 0.13% | 1.1%(-0.922)#570 | 1.2%(-1.06)#23,223 |
1
Common Questions
What are the Top Zip Codes with the Highest Percentage of Population Employed in Agriculture, Fishing & Hunting in Mishawaka, IN?
Top Zip Codes with the Highest Percentage of Population Employed in Agriculture, Fishing & Hunting in Mishawaka, IN are:
What zip code has the Highest Percentage of Population Employed in Agriculture, Fishing & Hunting in Mishawaka, IN?
46545 has the Highest Percentage of Population Employed in Agriculture, Fishing & Hunting in Mishawaka, IN with 0.23%.
What is the Percentage of Population Employed in Agriculture, Fishing & Hunting in Mishawaka, IN?
Percentage of Population Employed in Agriculture, Fishing & Hunting in Mishawaka is 0.086%.
What is the Percentage of Population Employed in Agriculture, Fishing & Hunting in Indiana?
Percentage of Population Employed in Agriculture, Fishing & Hunting in Indiana is 1.1%.
What is the Percentage of Population Employed in Agriculture, Fishing & Hunting in the United States?
Percentage of Population Employed in Agriculture, Fishing & Hunting in the United States is 1.2%.