Zip Codes with the Highest Percentage of Households Heated by Bottled Gas / Liquid Propane in Marion, IN
RELATED REPORTS & OPTIONS
Bottled Gas / LP Heating
Marion
Compare Zip Codes
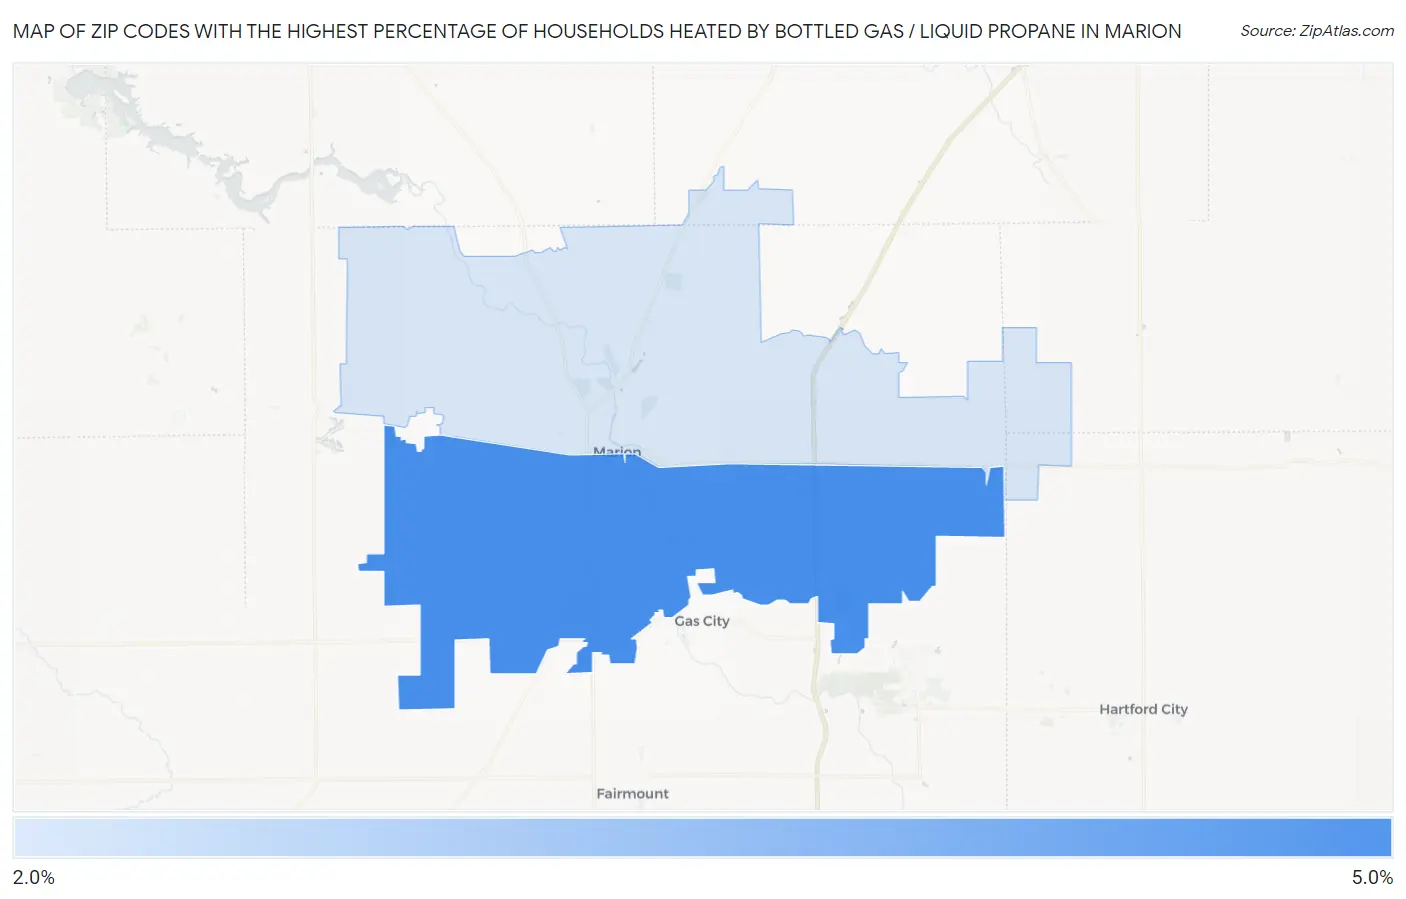
Map of Zip Codes with the Highest Percentage of Households Heated by Bottled Gas / Liquid Propane in Marion
0.0%
5.0%
Zip Codes with the Highest Percentage of Households Heated by Bottled Gas / Liquid Propane in Marion, IN
| Zip Code | Bottled Gas / LP Heating | vs State | vs National | |
| 1. | 46953 | 5.0% | 7.3%(-2.30)#537 | 4.9%(+0.100)#18,526 |
| 2. | 46952 | 2.8% | 7.3%(-4.50)#576 | 4.9%(-2.10)#21,397 |
1
Common Questions
What are the Top Zip Codes with the Highest Percentage of Households Heated by Bottled Gas / Liquid Propane in Marion, IN?
Top Zip Codes with the Highest Percentage of Households Heated by Bottled Gas / Liquid Propane in Marion, IN are:
What zip code has the Highest Percentage of Households Heated by Bottled Gas / Liquid Propane in Marion, IN?
46953 has the Highest Percentage of Households Heated by Bottled Gas / Liquid Propane in Marion, IN with 5.0%.
What is the Percentage of Households Heated by Bottled Gas / Liquid Propane in Marion, IN?
Percentage of Households Heated by Bottled Gas / Liquid Propane in Marion is 1.2%.
What is the Percentage of Households Heated by Bottled Gas / Liquid Propane in Indiana?
Percentage of Households Heated by Bottled Gas / Liquid Propane in Indiana is 7.3%.
What is the Percentage of Households Heated by Bottled Gas / Liquid Propane in the United States?
Percentage of Households Heated by Bottled Gas / Liquid Propane in the United States is 4.9%.