Zip Codes with the Highest Percentage of White / Caucasian Population in Indianapolis, IN

RELATED REPORTS & OPTIONS

White / Caucasian
Population
Families and Households
Female Fertility
Female Fertility (Unmarried)
Race (Community Size)
Race (Percentage)
Ancestry (Community Size)
AfghanAfricanAlaskan AthabascanAlbanianAlsatianAmericanApacheArabArgentineanArmenianAustralianAustrianBahamianBangladeshiBarbadianBasqueBelgianBelizeanBhutaneseBlackfeetBolivianBrazilianBritishBritish West IndianBulgarianBurmeseCajunCanadianCelticCentral AmericanCentral American IndianCherokeeChickasawChileanChippewaChoctawColombianCosta RicanCroatianCrowCubanCzechCzechoslovakianDanishDominicanDutchEastern EuropeanEcuadorianEgyptianEnglishEstonianEthiopianEuropeanFilipinoFinnishFrenchFrench CanadianGermanGerman RussianGhanaianGreekGuamanian / ChamorroGuatemalanGuyaneseHaitianHonduranHopiHungarianIcelanderIndian (Asian)IndonesianInupiatIranianIraqiIrishIroquoisIsraeliItalianJamaicanJapaneseJordanianKenyanKoreanLaotianLatvianLebaneseLiberianLithuanianLuxembourgerMacedonianMalaysianMenomineeMexicanMexican American IndianMongolianMoroccanNative HawaiianNavajoNew ZealanderNicaraguanNigerianNorthern EuropeanNorwegianPakistaniPalestinianPanamanianPennsylvania GermanPeruvianPolishPortuguesePotawatomiPuerto RicanRomanianRussianSalvadoranSamoanScandinavianScotch-IrishScottishSeminoleSenegaleseSerbianSierra LeoneanSiouxSlavicSlovakSloveneSouth AfricanSouth AmericanSouth American IndianSpaniardSpanishSri LankanSubsaharan AfricanSudaneseSwedishSwissSyrianThaiTonganTrinidadian and TobagonianTurkishUgandanUkrainianUruguayanVenezuelanVietnameseWelshWest IndianYugoslavianZimbabwean
Ancestry (Percentage)
AfghanAfricanAlaskan AthabascanAlbanianAlsatianAmericanApacheArabArgentineanArmenianAustralianAustrianBahamianBangladeshiBarbadianBasqueBelgianBelizeanBhutaneseBlackfeetBolivianBrazilianBritishBritish West IndianBulgarianBurmeseCajunCanadianCelticCentral AmericanCentral American IndianCherokeeChickasawChileanChippewaChoctawColombianCosta RicanCroatianCrowCubanCzechCzechoslovakianDanishDominicanDutchEastern EuropeanEcuadorianEgyptianEnglishEstonianEthiopianEuropeanFilipinoFinnishFrenchFrench CanadianGermanGerman RussianGhanaianGreekGuamanian / ChamorroGuatemalanGuyaneseHaitianHonduranHopiHungarianIcelanderIndian (Asian)IndonesianInupiatIranianIraqiIrishIroquoisIsraeliItalianJamaicanJapaneseJordanianKenyanKoreanLaotianLatvianLebaneseLiberianLithuanianLuxembourgerMacedonianMalaysianMenomineeMexicanMexican American IndianMongolianMoroccanNative HawaiianNavajoNew ZealanderNicaraguanNigerianNorthern EuropeanNorwegianPakistaniPalestinianPanamanianPennsylvania GermanPeruvianPolishPortuguesePotawatomiPuerto RicanRomanianRussianSalvadoranSamoanScandinavianScotch-IrishScottishSeminoleSenegaleseSerbianSierra LeoneanSiouxSlavicSlovakSloveneSouth AfricanSouth AmericanSouth American IndianSpaniardSpanishSri LankanSubsaharan AfricanSudaneseSwedishSwissSyrianThaiTonganTrinidadian and TobagonianTurkishUgandanUkrainianUruguayanVenezuelanVietnameseWelshWest IndianYugoslavianZimbabwean
Immigrant Origin (Total)
AfghanistanAfricaArgentinaAsiaAustraliaAustriaBahamasBangladeshBarbadosBelarusBoliviaBosnia and HerzegovinaBrazilBulgariaBurma / MyanmarCambodiaCameroonCanadaCaribbeanCentral AmericaChileChinaColombiaCongoCosta RicaCubaDenmarkDominican RepublicEastern AfricaEastern AsiaEastern EuropeEcuadorEgyptEl SalvadorEnglandEritreaEthiopiaEuropeFranceGermanyGhanaGreeceGuatemalaGuyanaHaitiHondurasHong KongHungaryIndiaIndonesiaIranIraqIrelandIsraelItalyJamaicaJapanJordanKenyaKoreaLaosLatin AmericaLatviaLebanonLiberiaMalaysiaMexicoMiddle AfricaMoldovaMoroccoNepalNetherlandsNicaraguaNigeriaNorth MacedoniaNorthern AfricaNorthern EuropeNorwayOceaniaPakistanPanamaPeruPhilippinesPolandPortugalRomaniaRussiaSaudi ArabiaScotlandSenegalSerbiaSierra LeoneSingaporeSouth AfricaSouth AmericaSouth Central AsiaSouth Eastern AsiaSouthern EuropeSpainSt. Vincent and the GrenadinesSudanSyriaTaiwanThailandTrinidad and TobagoTurkeyUgandaUkraineUzbekistanVenezuelaVietnamWest IndiesWestern AfricaWestern AsiaWestern EuropeYemenZaireZimbabwe
Immigrant Origin (Percentage)
AfghanistanAfricaArgentinaAsiaAustraliaAustriaBahamasBangladeshBarbadosBelarusBoliviaBosnia and HerzegovinaBrazilBulgariaBurma / MyanmarCambodiaCameroonCanadaCaribbeanCentral AmericaChileChinaColombiaCongoCosta RicaCubaDenmarkDominican RepublicEastern AfricaEastern AsiaEastern EuropeEcuadorEgyptEl SalvadorEnglandEritreaEthiopiaEuropeFranceGermanyGhanaGreeceGuatemalaGuyanaHaitiHondurasHong KongHungaryIndiaIndonesiaIranIraqIrelandIsraelItalyJamaicaJapanJordanKenyaKoreaLaosLatin AmericaLatviaLebanonLiberiaMalaysiaMexicoMiddle AfricaMoldovaMoroccoNepalNetherlandsNicaraguaNigeriaNorth MacedoniaNorthern AfricaNorthern EuropeNorwayOceaniaPakistanPanamaPeruPhilippinesPolandPortugalRomaniaRussiaSaudi ArabiaScotlandSenegalSerbiaSierra LeoneSingaporeSouth AfricaSouth AmericaSouth Central AsiaSouth Eastern AsiaSouthern EuropeSpainSt. Vincent and the GrenadinesSudanSyriaTaiwanThailandTrinidad and TobagoTurkeyUgandaUkraineUzbekistanVenezuelaVietnamWest IndiesWestern AfricaWestern AsiaWestern EuropeYemenZaireZimbabwe
Income
Income (Families)
Income (Households)
Poverty
Poverty (Families)
Unemployment
Employment Occupations
Employment Industries
Employer Class
Commute Time
Commute Means
School Enrollment
Education by Degree Field
Occupancy
Finances
Physical Characteristics
Indianapolis
Compare Zip Codes
Comparison Subject

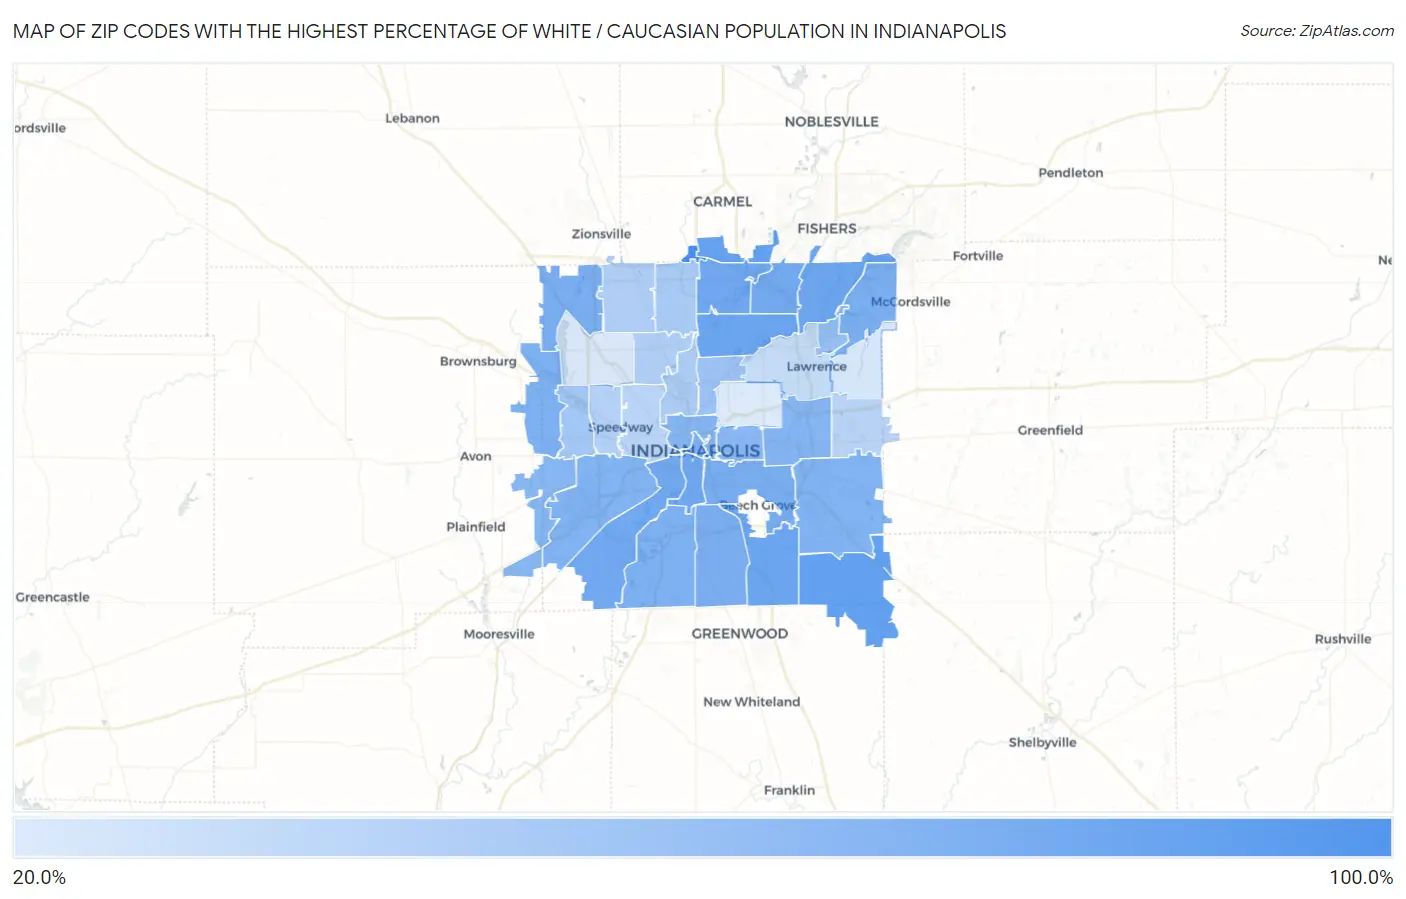
Map of Zip Codes with the Highest Percentage of White / Caucasian Population in Indianapolis

0.0%
100.0%
Zip Codes with the Highest Percentage of White / Caucasian Population in Indianapolis Map

Zip Codes with the Highest Percentage of White / Caucasian Population in Indianapolis, IN

Zip Code White / Caucasian vs State vs National
1.46290100.0%80.0%(+20.0)#5865.9%(+34.1)#1,775
2.4625982.8%80.0%(+2.81)#64365.9%(+16.9)#19,603
3.4628081.2%80.0%(+1.27)#66265.9%(+15.4)#20,384
4.4622077.8%80.0%(-2.22)#68965.9%(+11.9)#21,962
5.4623777.7%80.0%(-2.25)#69065.9%(+11.9)#21,976
6.4625675.8%80.0%(-4.14)#69965.9%(+9.96)#22,731
7.4622174.7%80.0%(-5.25)#70465.9%(+8.86)#23,163
8.4624074.5%80.0%(-5.46)#70665.9%(+8.64)#23,229
9.4622574.3%80.0%(-5.72)#70765.9%(+8.38)#23,308
10.4625073.4%80.0%(-6.62)#71365.9%(+7.48)#23,627
11.4620370.5%80.0%(-9.52)#72165.9%(+4.58)#24,587
12.4627869.2%80.0%(-10.8)#72465.9%(+3.30)#24,944
13.4622769.0%80.0%(-10.9)#72665.9%(+3.15)#24,982
14.4623668.8%80.0%(-11.2)#72765.9%(+2.90)#25,051
15.4620467.6%80.0%(-12.4)#72865.9%(+1.70)#25,400
16.4623467.3%80.0%(-12.6)#72965.9%(+1.46)#25,464
17.4621767.1%80.0%(-12.9)#73065.9%(+1.23)#25,532
18.4623965.9%80.0%(-14.1)#73365.9%(+0.035)#25,858
19.4624165.7%80.0%(-14.3)#73665.9%(-0.208)#25,932
20.4621963.3%80.0%(-16.7)#74165.9%(-2.55)#26,529
21.4620263.3%80.0%(-16.7)#74265.9%(-2.57)#26,535
22.4623161.7%80.0%(-18.3)#74465.9%(-4.21)#26,911
23.4620160.7%80.0%(-19.3)#74765.9%(-5.20)#27,132
24.4621654.4%80.0%(-25.6)#75065.9%(-11.5)#28,407
25.4620552.2%80.0%(-27.8)#75365.9%(-13.7)#28,807
26.4621448.7%80.0%(-31.3)#75765.9%(-17.2)#29,390
27.4626046.4%80.0%(-33.6)#76065.9%(-19.5)#29,696
28.4620843.7%80.0%(-36.3)#76265.9%(-22.2)#30,083
29.4626843.3%80.0%(-36.7)#76365.9%(-22.6)#30,141
30.4622842.5%80.0%(-37.5)#76465.9%(-23.4)#30,245
31.4622441.1%80.0%(-38.9)#76565.9%(-24.8)#30,412
32.4622938.3%80.0%(-41.7)#76865.9%(-27.6)#30,721
33.4622237.1%80.0%(-42.9)#76965.9%(-28.8)#30,862
34.4622632.8%80.0%(-47.2)#77365.9%(-33.1)#31,242
35.4623525.3%80.0%(-54.6)#77665.9%(-40.5)#31,800
36.4625424.5%80.0%(-55.5)#77765.9%(-41.4)#31,855
37.4621822.9%80.0%(-57.0)#77865.9%(-42.9)#31,959

Common Questions

What are the Top 10 Zip Codes with the Highest Percentage of White / Caucasian Population in Indianapolis, IN?
Top 10 Zip Codes with the Highest Percentage of White / Caucasian Population in Indianapolis, IN are:
#1
100.0%
#2
82.8%
#3
81.2%
#4
77.8%
#5
77.7%
#6
75.8%
#7
74.7%
#8
74.5%
#9
74.3%
#10
73.4%
What zip code has the Highest Percentage of White / Caucasian Population in Indianapolis, IN?
46290 has the Highest Percentage of White / Caucasian Population in Indianapolis, IN with 100.0%.
What is the Percentage of White / Caucasian Population in Indianapolis, IN?
Percentage of White / Caucasian Population in Indianapolis is 55.7%.
What is the Percentage of White / Caucasian Population in Indiana?
Percentage of White / Caucasian Population in Indiana is 80.0%.
What is the Percentage of White / Caucasian Population in the United States?
Percentage of White / Caucasian Population in the United States is 65.9%.