Zip Codes with the Highest Percentage of Self-Employed / Incorporated in Indianapolis, IN

RELATED REPORTS & OPTIONS

Self-Employed / Incorporated
Population
Families and Households
Female Fertility
Female Fertility (Unmarried)
Race (Community Size)
Race (Percentage)
Ancestry (Community Size)
AfghanAfricanAlaskan AthabascanAlbanianAlsatianAmericanApacheArabArgentineanArmenianAustralianAustrianBahamianBangladeshiBarbadianBasqueBelgianBelizeanBhutaneseBlackfeetBolivianBrazilianBritishBritish West IndianBulgarianBurmeseCajunCanadianCelticCentral AmericanCentral American IndianCherokeeChickasawChileanChippewaChoctawColombianCosta RicanCroatianCrowCubanCzechCzechoslovakianDanishDominicanDutchEastern EuropeanEcuadorianEgyptianEnglishEstonianEthiopianEuropeanFilipinoFinnishFrenchFrench CanadianGermanGerman RussianGhanaianGreekGuamanian / ChamorroGuatemalanGuyaneseHaitianHonduranHopiHungarianIcelanderIndian (Asian)IndonesianInupiatIranianIraqiIrishIroquoisIsraeliItalianJamaicanJapaneseJordanianKenyanKoreanLaotianLatvianLebaneseLiberianLithuanianLuxembourgerMacedonianMalaysianMenomineeMexicanMexican American IndianMongolianMoroccanNative HawaiianNavajoNew ZealanderNicaraguanNigerianNorthern EuropeanNorwegianPakistaniPalestinianPanamanianPennsylvania GermanPeruvianPolishPortuguesePotawatomiPuerto RicanRomanianRussianSalvadoranSamoanScandinavianScotch-IrishScottishSeminoleSenegaleseSerbianSierra LeoneanSiouxSlavicSlovakSloveneSouth AfricanSouth AmericanSouth American IndianSpaniardSpanishSri LankanSubsaharan AfricanSudaneseSwedishSwissSyrianThaiTonganTrinidadian and TobagonianTurkishUgandanUkrainianUruguayanVenezuelanVietnameseWelshWest IndianYugoslavianZimbabwean
Ancestry (Percentage)
AfghanAfricanAlaskan AthabascanAlbanianAlsatianAmericanApacheArabArgentineanArmenianAustralianAustrianBahamianBangladeshiBarbadianBasqueBelgianBelizeanBhutaneseBlackfeetBolivianBrazilianBritishBritish West IndianBulgarianBurmeseCajunCanadianCelticCentral AmericanCentral American IndianCherokeeChickasawChileanChippewaChoctawColombianCosta RicanCroatianCrowCubanCzechCzechoslovakianDanishDominicanDutchEastern EuropeanEcuadorianEgyptianEnglishEstonianEthiopianEuropeanFilipinoFinnishFrenchFrench CanadianGermanGerman RussianGhanaianGreekGuamanian / ChamorroGuatemalanGuyaneseHaitianHonduranHopiHungarianIcelanderIndian (Asian)IndonesianInupiatIranianIraqiIrishIroquoisIsraeliItalianJamaicanJapaneseJordanianKenyanKoreanLaotianLatvianLebaneseLiberianLithuanianLuxembourgerMacedonianMalaysianMenomineeMexicanMexican American IndianMongolianMoroccanNative HawaiianNavajoNew ZealanderNicaraguanNigerianNorthern EuropeanNorwegianPakistaniPalestinianPanamanianPennsylvania GermanPeruvianPolishPortuguesePotawatomiPuerto RicanRomanianRussianSalvadoranSamoanScandinavianScotch-IrishScottishSeminoleSenegaleseSerbianSierra LeoneanSiouxSlavicSlovakSloveneSouth AfricanSouth AmericanSouth American IndianSpaniardSpanishSri LankanSubsaharan AfricanSudaneseSwedishSwissSyrianThaiTonganTrinidadian and TobagonianTurkishUgandanUkrainianUruguayanVenezuelanVietnameseWelshWest IndianYugoslavianZimbabwean
Immigrant Origin (Total)
AfghanistanAfricaArgentinaAsiaAustraliaAustriaBahamasBangladeshBarbadosBelarusBoliviaBosnia and HerzegovinaBrazilBulgariaBurma / MyanmarCambodiaCameroonCanadaCaribbeanCentral AmericaChileChinaColombiaCongoCosta RicaCubaDenmarkDominican RepublicEastern AfricaEastern AsiaEastern EuropeEcuadorEgyptEl SalvadorEnglandEritreaEthiopiaEuropeFranceGermanyGhanaGreeceGuatemalaGuyanaHaitiHondurasHong KongHungaryIndiaIndonesiaIranIraqIrelandIsraelItalyJamaicaJapanJordanKenyaKoreaLaosLatin AmericaLatviaLebanonLiberiaMalaysiaMexicoMiddle AfricaMoldovaMoroccoNepalNetherlandsNicaraguaNigeriaNorth MacedoniaNorthern AfricaNorthern EuropeNorwayOceaniaPakistanPanamaPeruPhilippinesPolandPortugalRomaniaRussiaSaudi ArabiaScotlandSenegalSerbiaSierra LeoneSingaporeSouth AfricaSouth AmericaSouth Central AsiaSouth Eastern AsiaSouthern EuropeSpainSt. Vincent and the GrenadinesSudanSyriaTaiwanThailandTrinidad and TobagoTurkeyUgandaUkraineUzbekistanVenezuelaVietnamWest IndiesWestern AfricaWestern AsiaWestern EuropeYemenZaireZimbabwe
Immigrant Origin (Percentage)
AfghanistanAfricaArgentinaAsiaAustraliaAustriaBahamasBangladeshBarbadosBelarusBoliviaBosnia and HerzegovinaBrazilBulgariaBurma / MyanmarCambodiaCameroonCanadaCaribbeanCentral AmericaChileChinaColombiaCongoCosta RicaCubaDenmarkDominican RepublicEastern AfricaEastern AsiaEastern EuropeEcuadorEgyptEl SalvadorEnglandEritreaEthiopiaEuropeFranceGermanyGhanaGreeceGuatemalaGuyanaHaitiHondurasHong KongHungaryIndiaIndonesiaIranIraqIrelandIsraelItalyJamaicaJapanJordanKenyaKoreaLaosLatin AmericaLatviaLebanonLiberiaMalaysiaMexicoMiddle AfricaMoldovaMoroccoNepalNetherlandsNicaraguaNigeriaNorth MacedoniaNorthern AfricaNorthern EuropeNorwayOceaniaPakistanPanamaPeruPhilippinesPolandPortugalRomaniaRussiaSaudi ArabiaScotlandSenegalSerbiaSierra LeoneSingaporeSouth AfricaSouth AmericaSouth Central AsiaSouth Eastern AsiaSouthern EuropeSpainSt. Vincent and the GrenadinesSudanSyriaTaiwanThailandTrinidad and TobagoTurkeyUgandaUkraineUzbekistanVenezuelaVietnamWest IndiesWestern AfricaWestern AsiaWestern EuropeYemenZaireZimbabwe
Income
Income (Families)
Income (Households)
Poverty
Poverty (Families)
Unemployment
Employment Occupations
Employment Industries
Employer Class
Commute Time
Commute Means
School Enrollment
Education by Degree Field
Occupancy
Finances
Physical Characteristics
Indianapolis
Compare Zip Codes
Comparison Subject

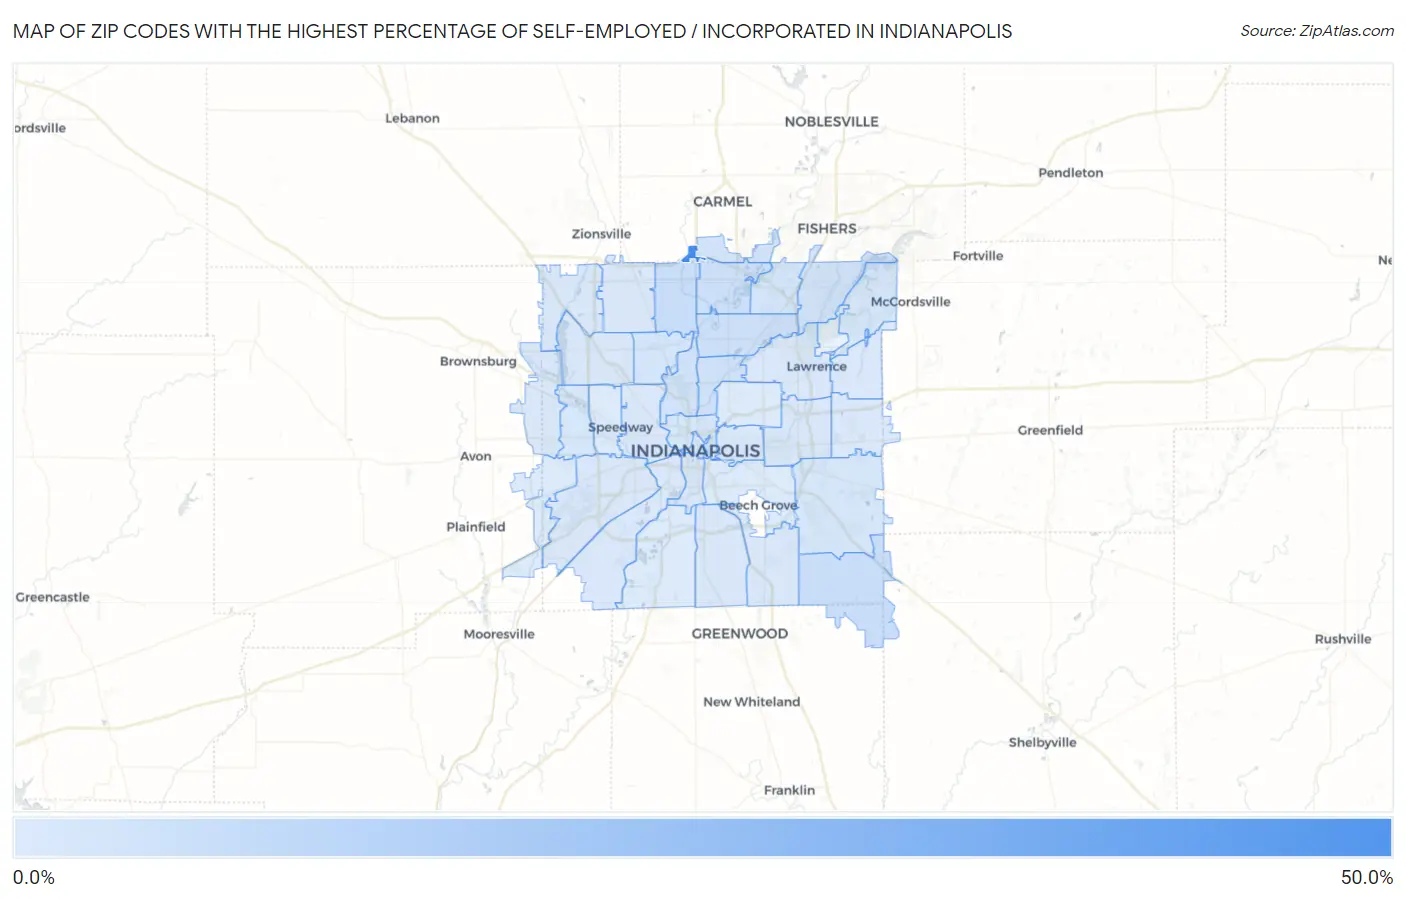
Map of Zip Codes with the Highest Percentage of Self-Employed / Incorporated in Indianapolis

0.0%
50.0%
Zip Codes with the Highest Percentage of Self-Employed / Incorporated in Indianapolis Map

Zip Codes with the Highest Percentage of Self-Employed / Incorporated in Indianapolis, IN

Zip Code % Self-Employed / Incorporated vs State vs National
1.4629044.8%3.2%(+41.6)#23.8%(+41.0)#109
2.462606.4%3.2%(+3.21)#843.8%(+2.62)#5,583
3.462596.4%3.2%(+3.14)#883.8%(+2.54)#5,703
4.462205.4%3.2%(+2.16)#1283.8%(+1.56)#7,630
5.462404.9%3.2%(+1.66)#1603.8%(+1.06)#8,933
6.462054.8%3.2%(+1.60)#1643.8%(+0.998)#9,132
7.462804.3%3.2%(+1.07)#2013.8%(+0.473)#10,847
8.462084.2%3.2%(+1.01)#2093.8%(+0.413)#11,079
9.462563.8%3.2%(+0.623)#2493.8%(+0.026)#12,575
10.462503.4%3.2%(+0.134)#2963.8%(-0.463)#14,712
11.462283.2%3.2%(+0.012)#3093.8%(-0.585)#15,246
12.462043.1%3.2%(-0.142)#3263.8%(-0.739)#15,991
13.462363.0%3.2%(-0.260)#3443.8%(-0.857)#16,598
14.462392.9%3.2%(-0.272)#3453.8%(-0.870)#16,658
15.462142.9%3.2%(-0.353)#3563.8%(-0.950)#17,057
16.462022.8%3.2%(-0.405)#3623.8%(-1.00)#17,309
17.462412.5%3.2%(-0.676)#4033.8%(-1.27)#18,682
18.462272.5%3.2%(-0.713)#4053.8%(-1.31)#18,858
19.462542.5%3.2%(-0.770)#4153.8%(-1.37)#19,141
20.462342.4%3.2%(-0.810)#4213.8%(-1.41)#19,345
21.462372.4%3.2%(-0.819)#4263.8%(-1.42)#19,399
22.462682.4%3.2%(-0.837)#4273.8%(-1.43)#19,468
23.462252.2%3.2%(-1.00)#4523.8%(-1.60)#20,274
24.462192.2%3.2%(-1.05)#4593.8%(-1.65)#20,565
25.462782.1%3.2%(-1.16)#4673.8%(-1.76)#21,059
26.462351.9%3.2%(-1.29)#4913.8%(-1.88)#21,672
27.462221.9%3.2%(-1.31)#4973.8%(-1.91)#21,794
28.462291.8%3.2%(-1.38)#5003.8%(-1.98)#22,101
29.462011.7%3.2%(-1.48)#5103.8%(-2.08)#22,497
30.462261.7%3.2%(-1.53)#5173.8%(-2.13)#22,711
31.462211.5%3.2%(-1.73)#5403.8%(-2.33)#23,527
32.462181.4%3.2%(-1.82)#5543.8%(-2.41)#23,859
33.462171.4%3.2%(-1.84)#5583.8%(-2.43)#23,946
34.462241.3%3.2%(-1.93)#5713.8%(-2.52)#24,277
35.462031.2%3.2%(-2.01)#5853.8%(-2.60)#24,590
36.462311.2%3.2%(-2.04)#5873.8%(-2.63)#24,705

Common Questions

What are the Top 10 Zip Codes with the Highest Percentage of Self-Employed / Incorporated in Indianapolis, IN?
Top 10 Zip Codes with the Highest Percentage of Self-Employed / Incorporated in Indianapolis, IN are:
#1
44.8%
#2
6.4%
#3
6.4%
#4
5.4%
#5
4.9%
#6
4.8%
#7
4.3%
#8
4.2%
#9
3.8%
#10
3.4%
What zip code has the Highest Percentage of Self-Employed / Incorporated in Indianapolis, IN?
46290 has the Highest Percentage of Self-Employed / Incorporated in Indianapolis, IN with 44.8%.
What is the Percentage of Self-Employed / Incorporated in Indianapolis, IN?
Percentage of Self-Employed / Incorporated in Indianapolis is 2.8%.
What is the Percentage of Self-Employed / Incorporated in Indiana?
Percentage of Self-Employed / Incorporated in Indiana is 3.2%.
What is the Percentage of Self-Employed / Incorporated in the United States?
Percentage of Self-Employed / Incorporated in the United States is 3.8%.