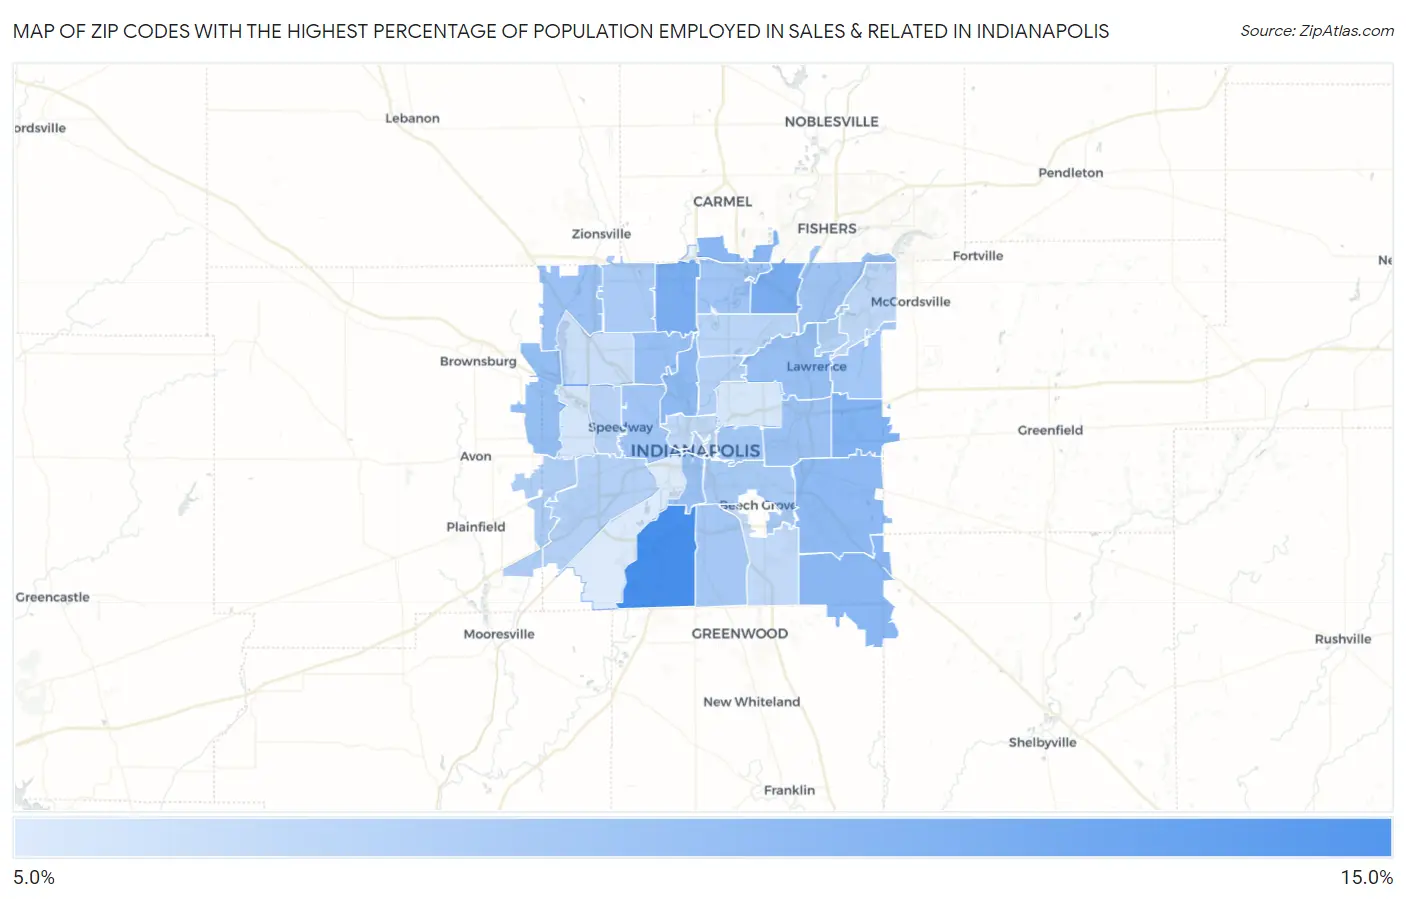
Zip Codes with the Highest Percentage of Population Employed in Sales & Related in Indianapolis, IN
RELATED REPORTS & OPTIONS
Sales & Related
Indianapolis
Compare Zip Codes
Map of Zip Codes with the Highest Percentage of Population Employed in Sales & Related in Indianapolis
6.1%
13.3%
Zip Codes with the Highest Percentage of Population Employed in Sales & Related in Indianapolis, IN
| Zip Code | % Employed | vs State | vs National | |
| 1. | 46217 | 13.3% | 8.8%(+4.50)#72 | 9.6%(+3.74)#4,115 |
| 2. | 46250 | 10.8% | 8.8%(+1.93)#164 | 9.6%(+1.18)#8,795 |
| 3. | 46260 | 10.8% | 8.8%(+1.93)#165 | 9.6%(+1.17)#8,818 |
| 4. | 46229 | 10.5% | 8.8%(+1.68)#178 | 9.6%(+0.923)#9,478 |
| 5. | 46259 | 10.0% | 8.8%(+1.19)#207 | 9.6%(+0.431)#10,926 |
| 6. | 46280 | 10.0% | 8.8%(+1.15)#209 | 9.6%(+0.399)#11,043 |
| 7. | 46208 | 9.8% | 8.8%(+0.997)#215 | 9.6%(+0.242)#11,511 |
| 8. | 46239 | 9.8% | 8.8%(+0.933)#223 | 9.6%(+0.178)#11,782 |
| 9. | 46234 | 9.5% | 8.8%(+0.671)#242 | 9.6%(-0.084)#12,708 |
| 10. | 46228 | 9.4% | 8.8%(+0.552)#252 | 9.6%(-0.202)#13,105 |
| 11. | 46226 | 9.4% | 8.8%(+0.511)#255 | 9.6%(-0.244)#13,245 |
| 12. | 46225 | 9.3% | 8.8%(+0.416)#258 | 9.6%(-0.339)#13,576 |
| 13. | 46219 | 9.2% | 8.8%(+0.336)#266 | 9.6%(-0.419)#13,883 |
| 14. | 46278 | 9.2% | 8.8%(+0.317)#267 | 9.6%(-0.438)#13,955 |
| 15. | 46240 | 8.9% | 8.8%(+0.089)#290 | 9.6%(-0.665)#14,777 |
| 16. | 46256 | 8.9% | 8.8%(+0.086)#292 | 9.6%(-0.669)#14,802 |
| 17. | 46222 | 8.9% | 8.8%(+0.063)#294 | 9.6%(-0.692)#14,888 |
| 18. | 46235 | 8.8% | 8.8%(-0.032)#296 | 9.6%(-0.787)#15,238 |
| 19. | 46201 | 8.8% | 8.8%(-0.078)#299 | 9.6%(-0.832)#15,392 |
| 20. | 46227 | 8.6% | 8.8%(-0.207)#310 | 9.6%(-0.962)#15,865 |
| 21. | 46203 | 8.6% | 8.8%(-0.221)#312 | 9.6%(-0.976)#15,910 |
| 22. | 46268 | 8.4% | 8.8%(-0.410)#330 | 9.6%(-1.16)#16,604 |
| 23. | 46231 | 8.3% | 8.8%(-0.561)#340 | 9.6%(-1.32)#17,138 |
| 24. | 46204 | 8.0% | 8.8%(-0.796)#358 | 9.6%(-1.55)#17,901 |
| 25. | 46205 | 8.0% | 8.8%(-0.839)#365 | 9.6%(-1.59)#18,047 |
| 26. | 46241 | 8.0% | 8.8%(-0.842)#367 | 9.6%(-1.60)#18,063 |
| 27. | 46216 | 8.0% | 8.8%(-0.846)#368 | 9.6%(-1.60)#18,079 |
| 28. | 46224 | 7.8% | 8.8%(-1.01)#389 | 9.6%(-1.76)#18,580 |
| 29. | 46220 | 7.7% | 8.8%(-1.18)#407 | 9.6%(-1.94)#19,144 |
| 30. | 46202 | 7.5% | 8.8%(-1.32)#420 | 9.6%(-2.08)#19,609 |
| 31. | 46236 | 7.4% | 8.8%(-1.40)#428 | 9.6%(-2.15)#19,857 |
| 32. | 46237 | 7.4% | 8.8%(-1.44)#433 | 9.6%(-2.19)#19,987 |
| 33. | 46254 | 7.1% | 8.8%(-1.78)#467 | 9.6%(-2.53)#21,002 |
| 34. | 46214 | 6.5% | 8.8%(-2.35)#499 | 9.6%(-3.11)#22,472 |
| 35. | 46218 | 6.4% | 8.8%(-2.46)#511 | 9.6%(-3.22)#22,766 |
| 36. | 46221 | 6.1% | 8.8%(-2.78)#534 | 9.6%(-3.54)#23,525 |
1
Common Questions
What are the Top 10 Zip Codes with the Highest Percentage of Population Employed in Sales & Related in Indianapolis, IN?
Top 10 Zip Codes with the Highest Percentage of Population Employed in Sales & Related in Indianapolis, IN are:
What zip code has the Highest Percentage of Population Employed in Sales & Related in Indianapolis, IN?
46217 has the Highest Percentage of Population Employed in Sales & Related in Indianapolis, IN with 13.3%.
What is the Percentage of Population Employed in Sales & Related in Indianapolis, IN?
Percentage of Population Employed in Sales & Related in Indianapolis is 8.7%.
What is the Percentage of Population Employed in Sales & Related in Indiana?
Percentage of Population Employed in Sales & Related in Indiana is 8.8%.
What is the Percentage of Population Employed in Sales & Related in the United States?
Percentage of Population Employed in Sales & Related in the United States is 9.6%.