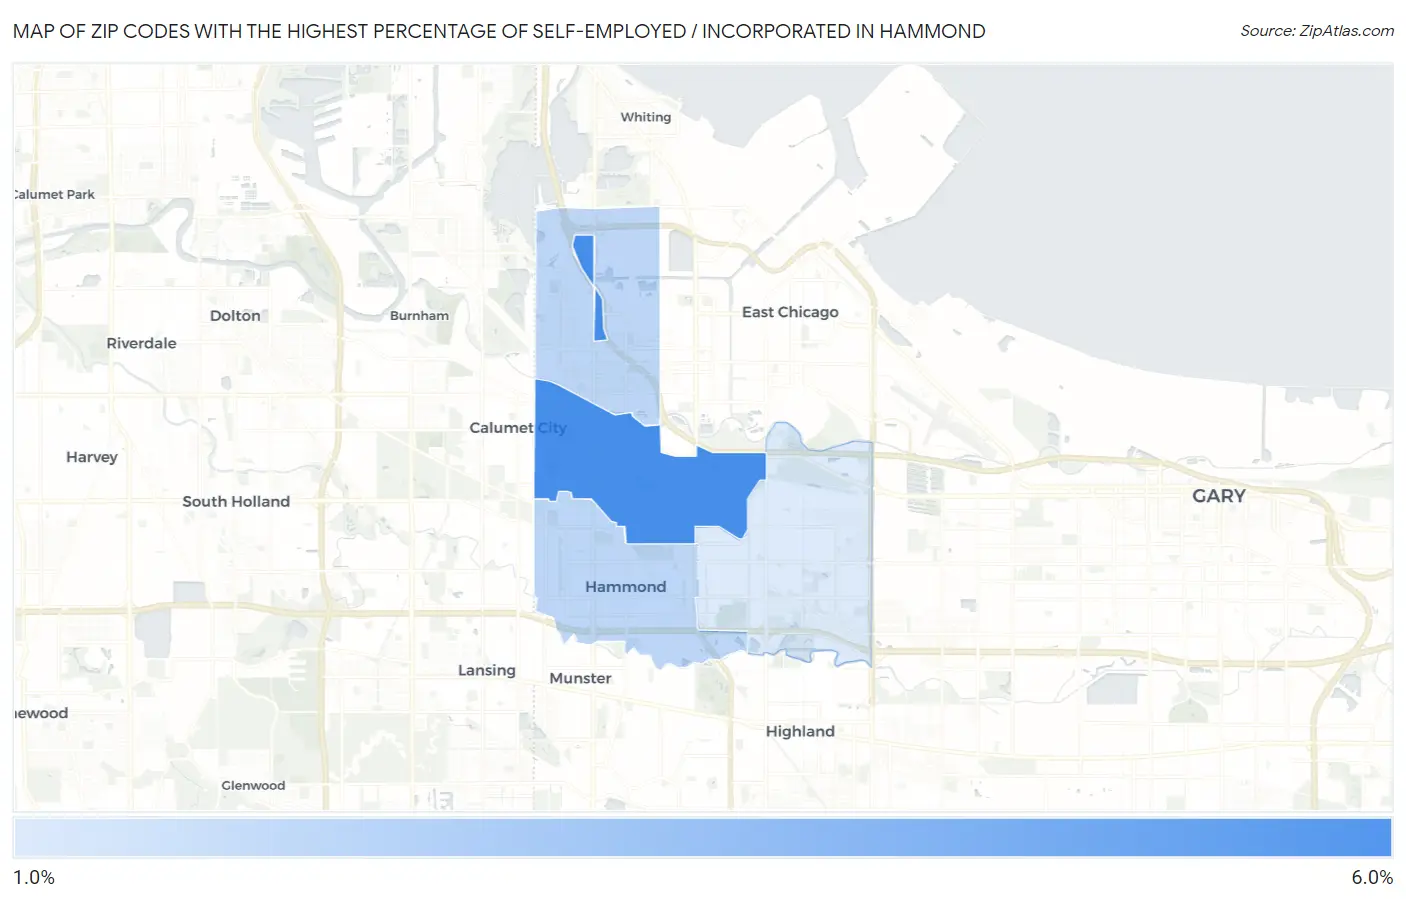
Zip Codes with the Highest Percentage of Self-Employed / Incorporated in Hammond, IN
RELATED REPORTS & OPTIONS
Self-Employed / Incorporated
Hammond
Compare Zip Codes
Map of Zip Codes with the Highest Percentage of Self-Employed / Incorporated in Hammond
1.4%
5.0%
Zip Codes with the Highest Percentage of Self-Employed / Incorporated in Hammond, IN
| Zip Code | % Self-Employed / Incorporated | vs State | vs National | |
| 1. | 46320 | 5.0% | 3.2%(+1.79)#150 | 3.8%(+1.19)#8,578 |
| 2. | 46327 | 2.2% | 3.2%(-1.06)#460 | 3.8%(-1.65)#20,578 |
| 3. | 46324 | 2.2% | 3.2%(-1.06)#461 | 3.8%(-1.66)#20,607 |
| 4. | 46323 | 1.4% | 3.2%(-1.80)#551 | 3.8%(-2.40)#23,779 |
1
Common Questions
What are the Top 3 Zip Codes with the Highest Percentage of Self-Employed / Incorporated in Hammond, IN?
Top 3 Zip Codes with the Highest Percentage of Self-Employed / Incorporated in Hammond, IN are:
What zip code has the Highest Percentage of Self-Employed / Incorporated in Hammond, IN?
46320 has the Highest Percentage of Self-Employed / Incorporated in Hammond, IN with 5.0%.
What is the Percentage of Self-Employed / Incorporated in Hammond, IN?
Percentage of Self-Employed / Incorporated in Hammond is 2.5%.
What is the Percentage of Self-Employed / Incorporated in Indiana?
Percentage of Self-Employed / Incorporated in Indiana is 3.2%.
What is the Percentage of Self-Employed / Incorporated in the United States?
Percentage of Self-Employed / Incorporated in the United States is 3.8%.