Zip Codes with the Highest Percentage of Population Employed in Arts, Entertainment & Recreation in Hammond, IN
RELATED REPORTS & OPTIONS
Arts, Entertainment & Recreation
Hammond
Compare Zip Codes
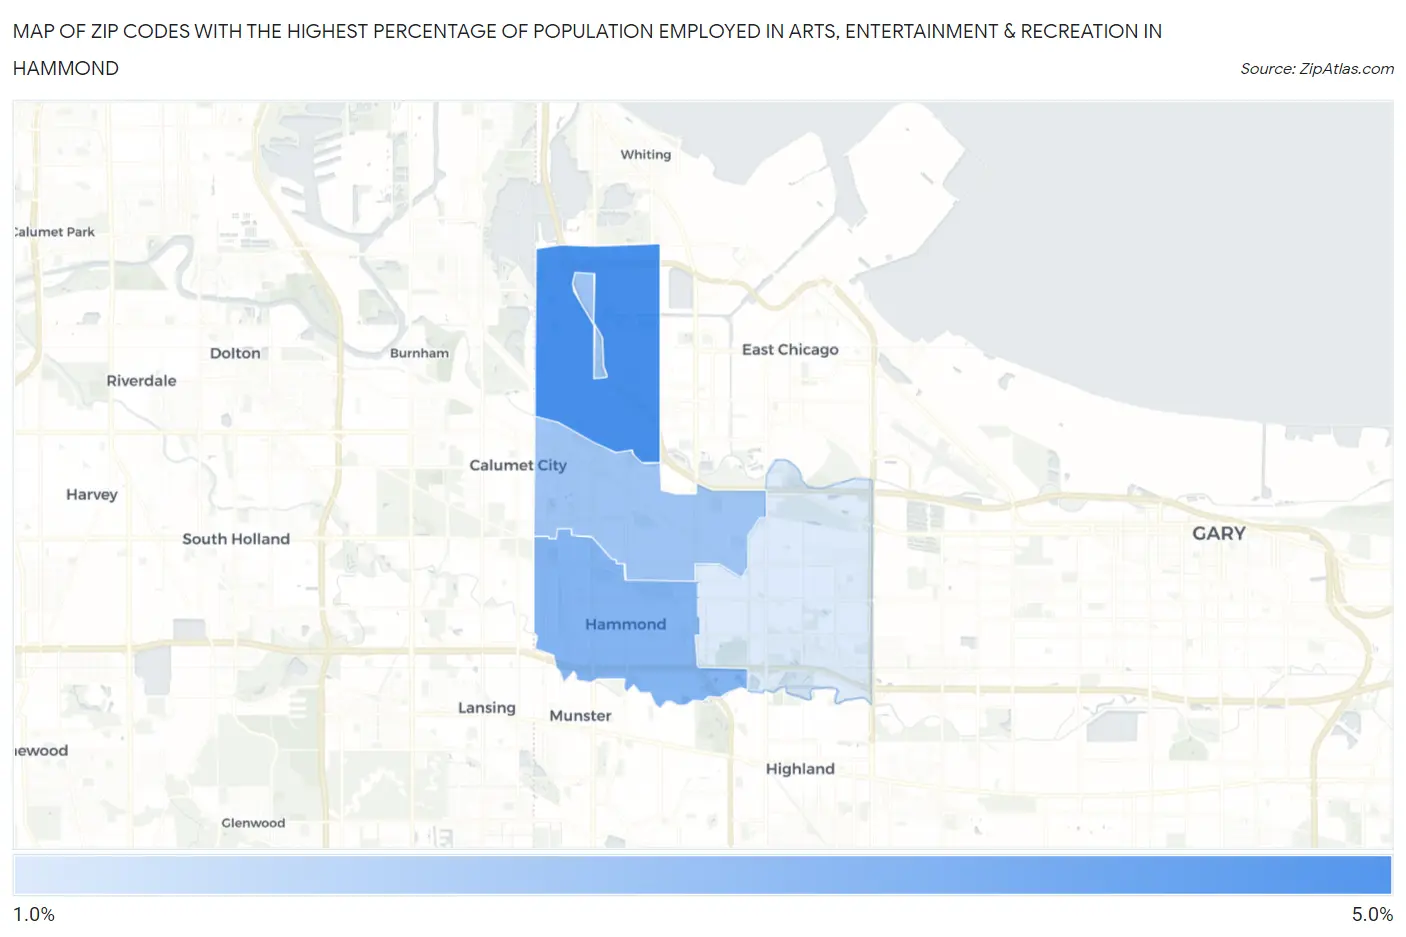
Map of Zip Codes with the Highest Percentage of Population Employed in Arts, Entertainment & Recreation in Hammond
0.0%
5.0%
Zip Codes with the Highest Percentage of Population Employed in Arts, Entertainment & Recreation in Hammond, IN
| Zip Code | % Employed | vs State | vs National | |
| 1. | 46327 | 4.1% | 1.6%(+2.50)#34 | 2.1%(+2.06)#3,159 |
| 2. | 46324 | 3.0% | 1.6%(+1.33)#78 | 2.1%(+0.887)#5,449 |
| 3. | 46320 | 2.4% | 1.6%(+0.756)#117 | 2.1%(+0.313)#7,663 |
| 4. | 46323 | 1.2% | 1.6%(-0.444)#281 | 2.1%(-0.887)#15,507 |
1
Common Questions
What are the Top 3 Zip Codes with the Highest Percentage of Population Employed in Arts, Entertainment & Recreation in Hammond, IN?
Top 3 Zip Codes with the Highest Percentage of Population Employed in Arts, Entertainment & Recreation in Hammond, IN are:
What zip code has the Highest Percentage of Population Employed in Arts, Entertainment & Recreation in Hammond, IN?
46327 has the Highest Percentage of Population Employed in Arts, Entertainment & Recreation in Hammond, IN with 4.1%.
What is the Percentage of Population Employed in Arts, Entertainment & Recreation in Hammond, IN?
Percentage of Population Employed in Arts, Entertainment & Recreation in Hammond is 2.7%.
What is the Percentage of Population Employed in Arts, Entertainment & Recreation in Indiana?
Percentage of Population Employed in Arts, Entertainment & Recreation in Indiana is 1.6%.
What is the Percentage of Population Employed in Arts, Entertainment & Recreation in the United States?
Percentage of Population Employed in Arts, Entertainment & Recreation in the United States is 2.1%.