Zip Codes with the Highest Percentage of Hispanic or Latino Population in Hammond, IN
RELATED REPORTS & OPTIONS
Hispanic or Latino
Hammond
Compare Zip Codes
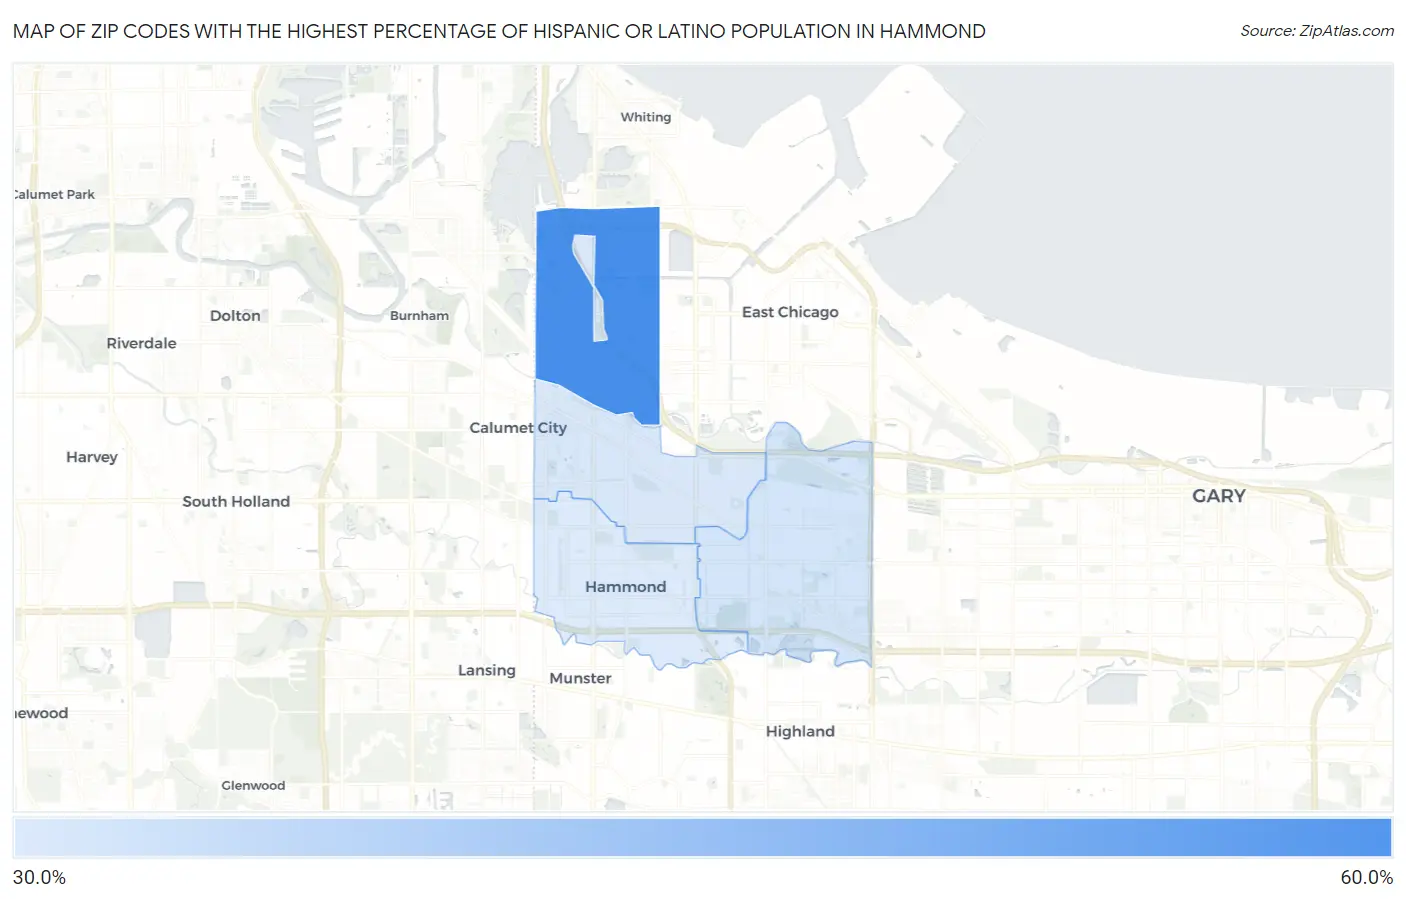
Map of Zip Codes with the Highest Percentage of Hispanic or Latino Population in Hammond
37.2%
58.2%
Zip Codes with the Highest Percentage of Hispanic or Latino Population in Hammond, IN
| Zip Code | Hispanic or Latino | vs State | vs National | |
| 1. | 46327 | 58.2% | 7.5%(+50.7)#1 | 18.7%(+39.6)#1,174 |
| 2. | 46323 | 38.4% | 7.5%(+30.9)#5 | 18.7%(+19.8)#2,281 |
| 3. | 46320 | 37.8% | 7.5%(+30.3)#7 | 18.7%(+19.2)#2,331 |
| 4. | 46324 | 37.2% | 7.5%(+29.6)#8 | 18.7%(+18.5)#2,378 |
1
Common Questions
What are the Top 3 Zip Codes with the Highest Percentage of Hispanic or Latino Population in Hammond, IN?
Top 3 Zip Codes with the Highest Percentage of Hispanic or Latino Population in Hammond, IN are:
What zip code has the Highest Percentage of Hispanic or Latino Population in Hammond, IN?
46327 has the Highest Percentage of Hispanic or Latino Population in Hammond, IN with 58.2%.
What is the Percentage of Hispanic or Latino Population in Hammond, IN?
Percentage of Hispanic or Latino Population in Hammond is 40.4%.
What is the Percentage of Hispanic or Latino Population in Indiana?
Percentage of Hispanic or Latino Population in Indiana is 7.5%.
What is the Percentage of Hispanic or Latino Population in the United States?
Percentage of Hispanic or Latino Population in the United States is 18.7%.