Zip Codes with the Highest Percentage of Population Employed in Transportation & Warehousing in Greenwood, IN
RELATED REPORTS & OPTIONS
Transportation & Warehousing
Greenwood
Compare Zip Codes
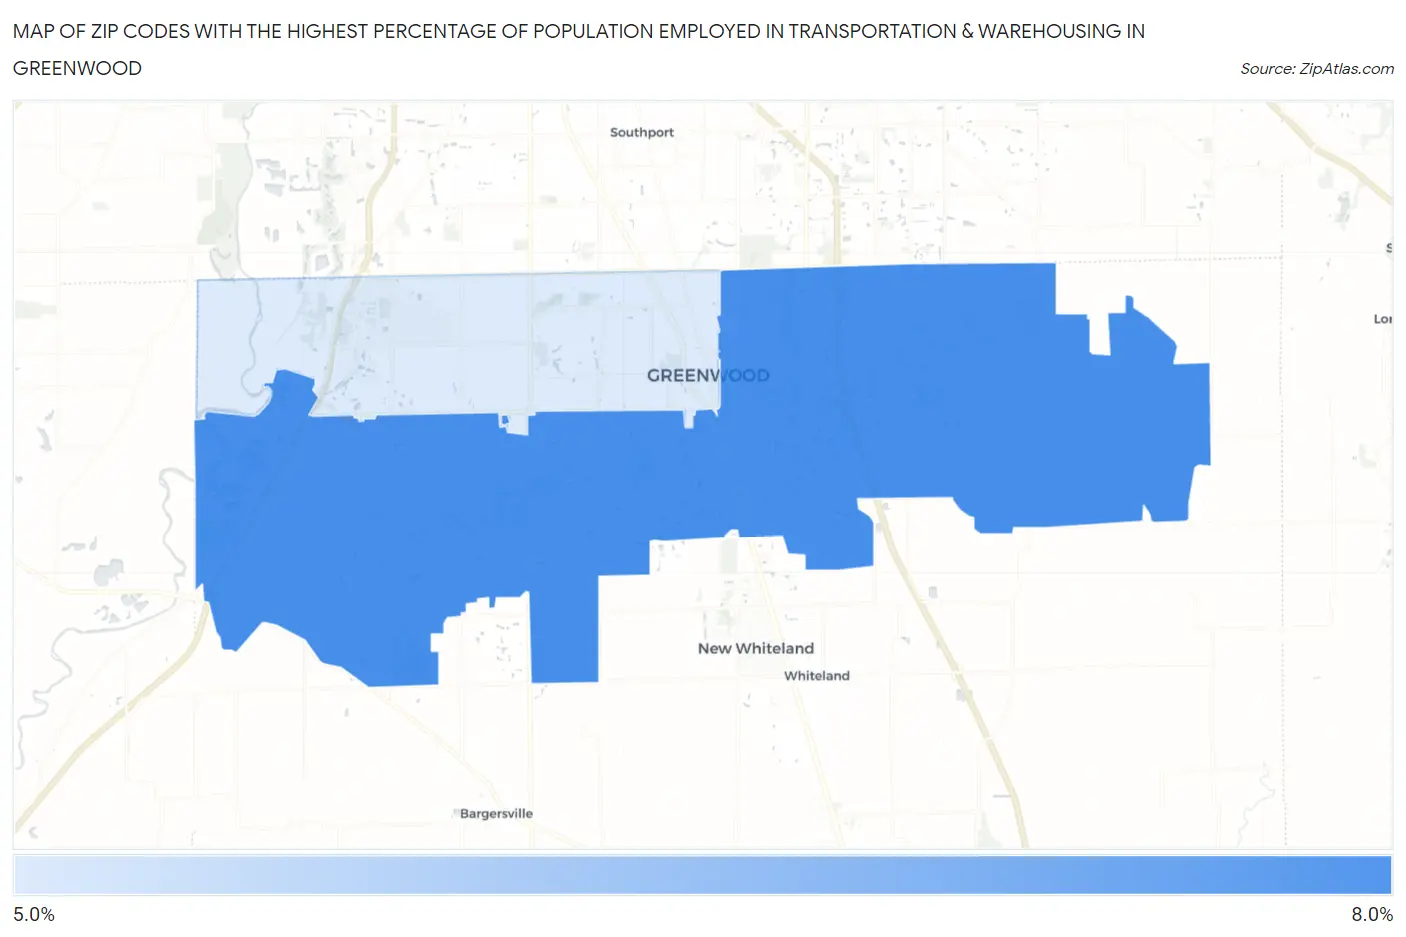
Map of Zip Codes with the Highest Percentage of Population Employed in Transportation & Warehousing in Greenwood
0.0%
8.0%
Zip Codes with the Highest Percentage of Population Employed in Transportation & Warehousing in Greenwood, IN
| Zip Code | % Employed | vs State | vs National | |
| 1. | 46143 | 7.1% | 5.1%(+1.96)#154 | 4.9%(+2.16)#6,342 |
| 2. | 46142 | 5.7% | 5.1%(+0.597)#244 | 4.9%(+0.793)#9,541 |
1
Common Questions
What are the Top Zip Codes with the Highest Percentage of Population Employed in Transportation & Warehousing in Greenwood, IN?
Top Zip Codes with the Highest Percentage of Population Employed in Transportation & Warehousing in Greenwood, IN are:
What zip code has the Highest Percentage of Population Employed in Transportation & Warehousing in Greenwood, IN?
46143 has the Highest Percentage of Population Employed in Transportation & Warehousing in Greenwood, IN with 7.1%.
What is the Percentage of Population Employed in Transportation & Warehousing in Greenwood, IN?
Percentage of Population Employed in Transportation & Warehousing in Greenwood is 8.0%.
What is the Percentage of Population Employed in Transportation & Warehousing in Indiana?
Percentage of Population Employed in Transportation & Warehousing in Indiana is 5.1%.
What is the Percentage of Population Employed in Transportation & Warehousing in the United States?
Percentage of Population Employed in Transportation & Warehousing in the United States is 4.9%.