Zip Codes with the Highest Percentage of Population Employed in Arts, Entertainment & Recreation in Greenwood, IN
RELATED REPORTS & OPTIONS
Arts, Entertainment & Recreation
Greenwood
Compare Zip Codes
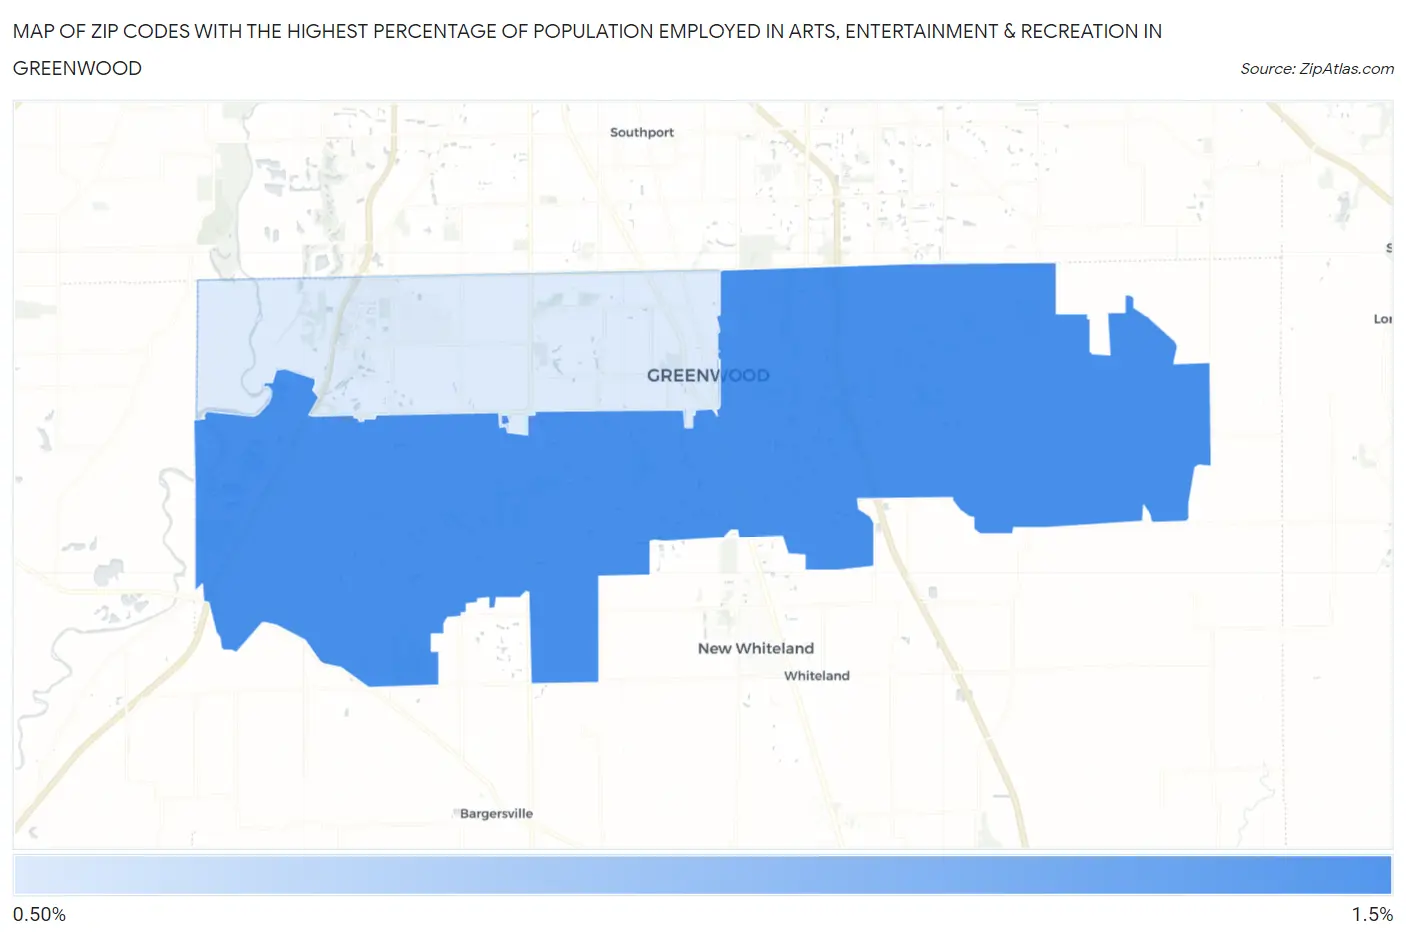
Map of Zip Codes with the Highest Percentage of Population Employed in Arts, Entertainment & Recreation in Greenwood
0.0%
1.5%
Zip Codes with the Highest Percentage of Population Employed in Arts, Entertainment & Recreation in Greenwood, IN
| Zip Code | % Employed | vs State | vs National | |
| 1. | 46143 | 1.1% | 1.6%(-0.520)#298 | 2.1%(-0.963)#16,090 |
| 2. | 46142 | 0.68% | 1.6%(-0.958)#392 | 2.1%(-1.40)#19,286 |
1
Common Questions
What are the Top Zip Codes with the Highest Percentage of Population Employed in Arts, Entertainment & Recreation in Greenwood, IN?
Top Zip Codes with the Highest Percentage of Population Employed in Arts, Entertainment & Recreation in Greenwood, IN are:
What zip code has the Highest Percentage of Population Employed in Arts, Entertainment & Recreation in Greenwood, IN?
46143 has the Highest Percentage of Population Employed in Arts, Entertainment & Recreation in Greenwood, IN with 1.1%.
What is the Percentage of Population Employed in Arts, Entertainment & Recreation in Greenwood, IN?
Percentage of Population Employed in Arts, Entertainment & Recreation in Greenwood is 0.63%.
What is the Percentage of Population Employed in Arts, Entertainment & Recreation in Indiana?
Percentage of Population Employed in Arts, Entertainment & Recreation in Indiana is 1.6%.
What is the Percentage of Population Employed in Arts, Entertainment & Recreation in the United States?
Percentage of Population Employed in Arts, Entertainment & Recreation in the United States is 2.1%.