Zip Codes with the Highest Percentage of Population Employed in Farming, Fishing & Forestry in Goshen, IN
RELATED REPORTS & OPTIONS
Farming, Fishing & Forestry
Goshen
Compare Zip Codes
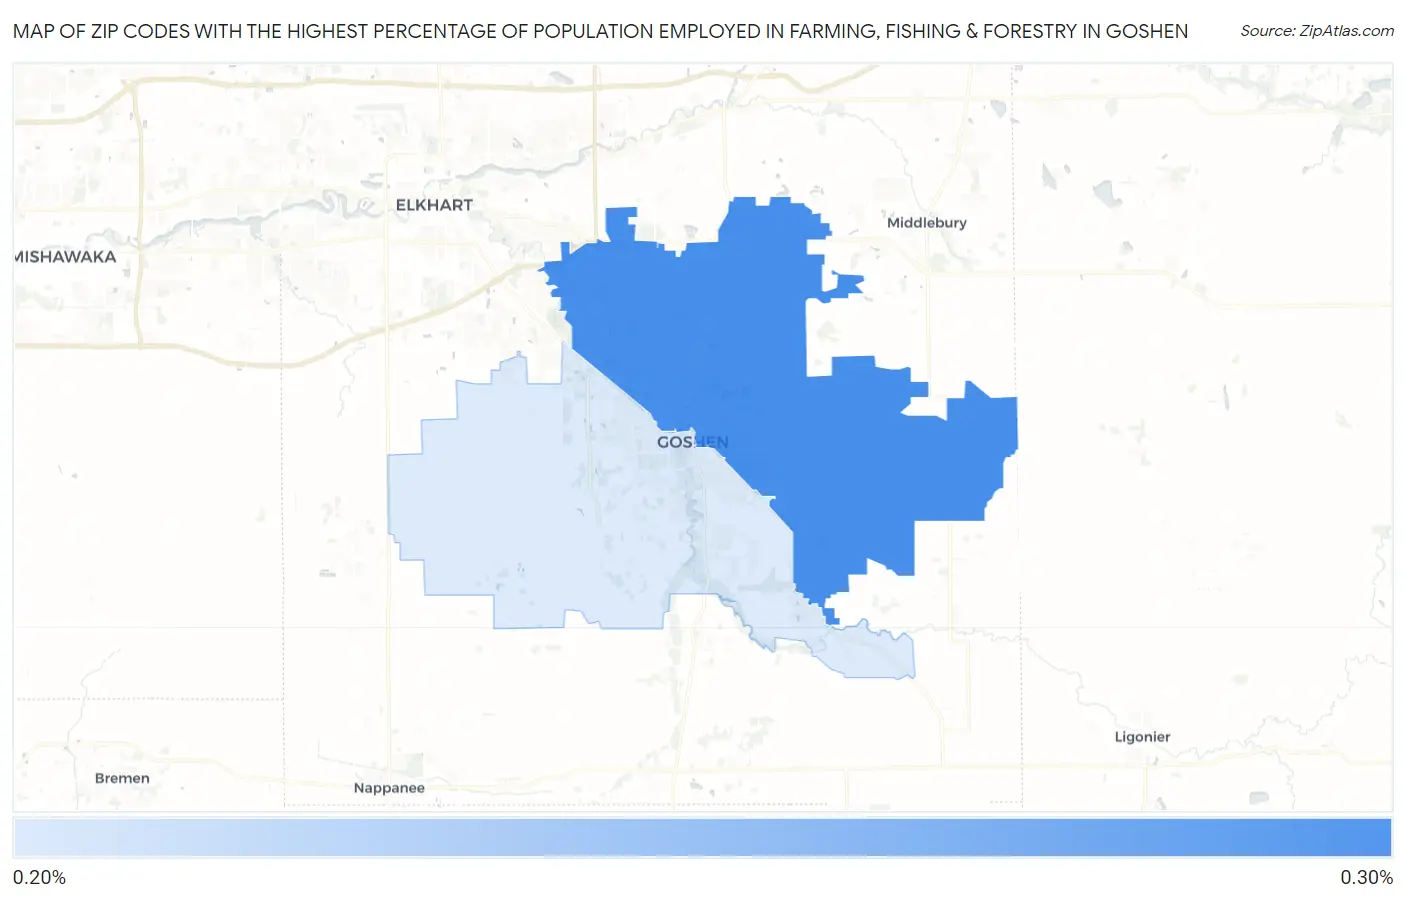
Map of Zip Codes with the Highest Percentage of Population Employed in Farming, Fishing & Forestry in Goshen
0.0%
0.30%
Zip Codes with the Highest Percentage of Population Employed in Farming, Fishing & Forestry in Goshen, IN
| Zip Code | % Employed | vs State | vs National | |
| 1. | 46528 | 0.29% | 0.39%(-0.097)#317 | 0.61%(-0.317)#14,964 |
| 2. | 46526 | 0.24% | 0.39%(-0.148)#330 | 0.61%(-0.369)#15,588 |
1
Common Questions
What are the Top Zip Codes with the Highest Percentage of Population Employed in Farming, Fishing & Forestry in Goshen, IN?
Top Zip Codes with the Highest Percentage of Population Employed in Farming, Fishing & Forestry in Goshen, IN are:
What zip code has the Highest Percentage of Population Employed in Farming, Fishing & Forestry in Goshen, IN?
46528 has the Highest Percentage of Population Employed in Farming, Fishing & Forestry in Goshen, IN with 0.29%.
What is the Percentage of Population Employed in Farming, Fishing & Forestry in Goshen, IN?
Percentage of Population Employed in Farming, Fishing & Forestry in Goshen is 0.17%.
What is the Percentage of Population Employed in Farming, Fishing & Forestry in Indiana?
Percentage of Population Employed in Farming, Fishing & Forestry in Indiana is 0.39%.
What is the Percentage of Population Employed in Farming, Fishing & Forestry in the United States?
Percentage of Population Employed in Farming, Fishing & Forestry in the United States is 0.61%.