Zip Codes with the Highest Percentage of Hispanic or Latino Population in Evansville, IN
RELATED REPORTS & OPTIONS
Hispanic or Latino
Evansville
Compare Zip Codes
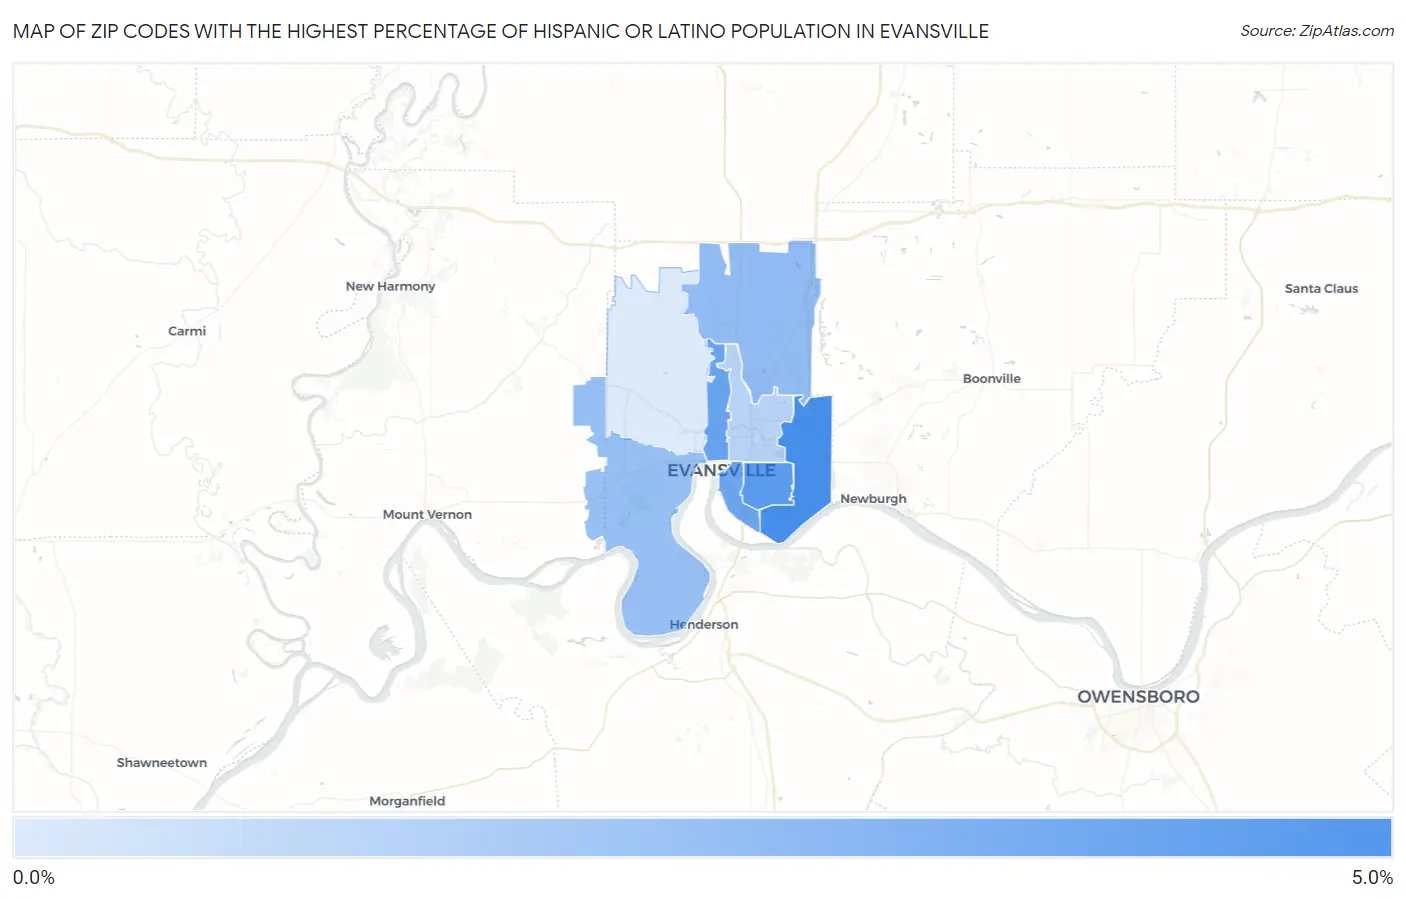
Map of Zip Codes with the Highest Percentage of Hispanic or Latino Population in Evansville
0.62%
4.6%
Zip Codes with the Highest Percentage of Hispanic or Latino Population in Evansville, IN
| Zip Code | Hispanic or Latino | vs State | vs National | |
| 1. | 47715 | 4.6% | 7.5%(-2.94)#231 | 18.7%(-14.1)#14,999 |
| 2. | 47714 | 4.1% | 7.5%(-3.43)#252 | 18.7%(-14.5)#15,922 |
| 3. | 47710 | 3.7% | 7.5%(-3.81)#275 | 18.7%(-14.9)#16,651 |
| 4. | 47713 | 3.5% | 7.5%(-3.99)#287 | 18.7%(-15.1)#17,057 |
| 5. | 47725 | 2.6% | 7.5%(-4.90)#362 | 18.7%(-16.0)#19,329 |
| 6. | 47712 | 2.4% | 7.5%(-5.12)#381 | 18.7%(-16.2)#19,905 |
| 7. | 47711 | 1.6% | 7.5%(-5.92)#446 | 18.7%(-17.0)#22,207 |
| 8. | 47720 | 0.62% | 7.5%(-6.91)#566 | 18.7%(-18.0)#25,342 |
1
Common Questions
What are the Top 5 Zip Codes with the Highest Percentage of Hispanic or Latino Population in Evansville, IN?
Top 5 Zip Codes with the Highest Percentage of Hispanic or Latino Population in Evansville, IN are:
What zip code has the Highest Percentage of Hispanic or Latino Population in Evansville, IN?
47715 has the Highest Percentage of Hispanic or Latino Population in Evansville, IN with 4.6%.
What is the Percentage of Hispanic or Latino Population in Evansville, IN?
Percentage of Hispanic or Latino Population in Evansville is 3.5%.
What is the Percentage of Hispanic or Latino Population in Indiana?
Percentage of Hispanic or Latino Population in Indiana is 7.5%.
What is the Percentage of Hispanic or Latino Population in the United States?
Percentage of Hispanic or Latino Population in the United States is 18.7%.