Zip Codes with the Highest Percentage of Population Employed in Farming, Fishing & Forestry in Evansville, IN
RELATED REPORTS & OPTIONS
Farming, Fishing & Forestry
Evansville
Compare Zip Codes
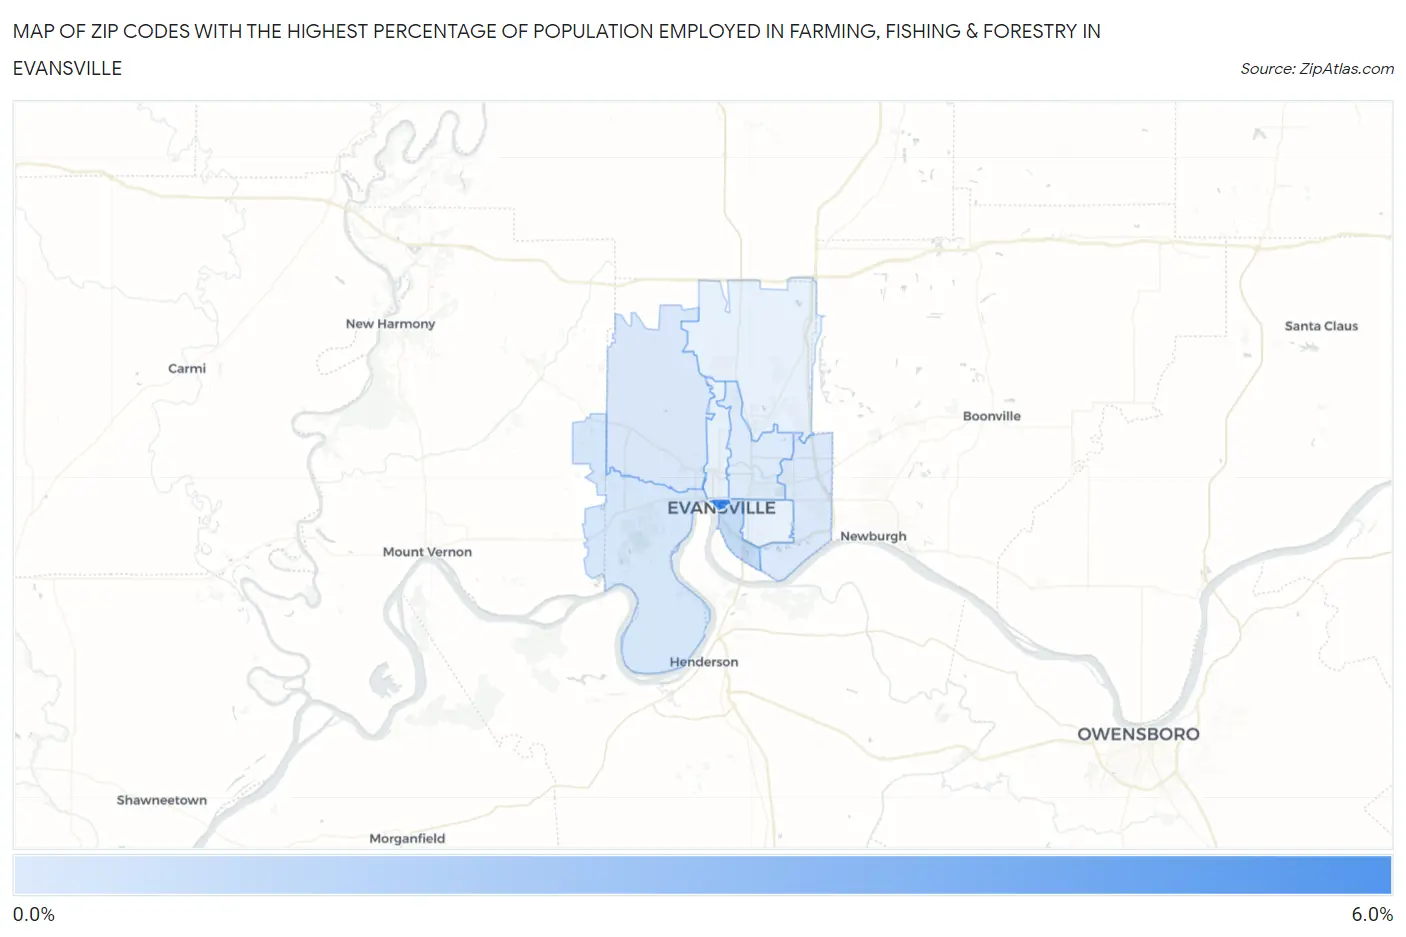
Map of Zip Codes with the Highest Percentage of Population Employed in Farming, Fishing & Forestry in Evansville
0.0%
6.0%
Zip Codes with the Highest Percentage of Population Employed in Farming, Fishing & Forestry in Evansville, IN
| Zip Code | % Employed | vs State | vs National | |
| 1. | 47708 | 5.1% | 0.39%(+4.72)#26 | 0.61%(+4.50)#2,860 |
| 2. | 47713 | 0.84% | 0.39%(+0.459)#187 | 0.61%(+0.239)#10,544 |
| 3. | 47712 | 0.26% | 0.39%(-0.123)#326 | 0.61%(-0.343)#15,250 |
| 4. | 47720 | 0.23% | 0.39%(-0.157)#335 | 0.61%(-0.377)#15,718 |
| 5. | 47715 | 0.13% | 0.39%(-0.260)#380 | 0.61%(-0.480)#17,341 |
| 6. | 47711 | 0.068% | 0.39%(-0.317)#396 | 0.61%(-0.537)#18,332 |
1
Common Questions
What are the Top 5 Zip Codes with the Highest Percentage of Population Employed in Farming, Fishing & Forestry in Evansville, IN?
Top 5 Zip Codes with the Highest Percentage of Population Employed in Farming, Fishing & Forestry in Evansville, IN are:
What zip code has the Highest Percentage of Population Employed in Farming, Fishing & Forestry in Evansville, IN?
47708 has the Highest Percentage of Population Employed in Farming, Fishing & Forestry in Evansville, IN with 5.1%.
What is the Percentage of Population Employed in Farming, Fishing & Forestry in Evansville, IN?
Percentage of Population Employed in Farming, Fishing & Forestry in Evansville is 0.15%.
What is the Percentage of Population Employed in Farming, Fishing & Forestry in Indiana?
Percentage of Population Employed in Farming, Fishing & Forestry in Indiana is 0.39%.
What is the Percentage of Population Employed in Farming, Fishing & Forestry in the United States?
Percentage of Population Employed in Farming, Fishing & Forestry in the United States is 0.61%.