Zip Codes with the Highest Percentage of Population Employed in Arts, Entertainment & Recreation in Columbus, IN
RELATED REPORTS & OPTIONS
Arts, Entertainment & Recreation
Columbus
Compare Zip Codes
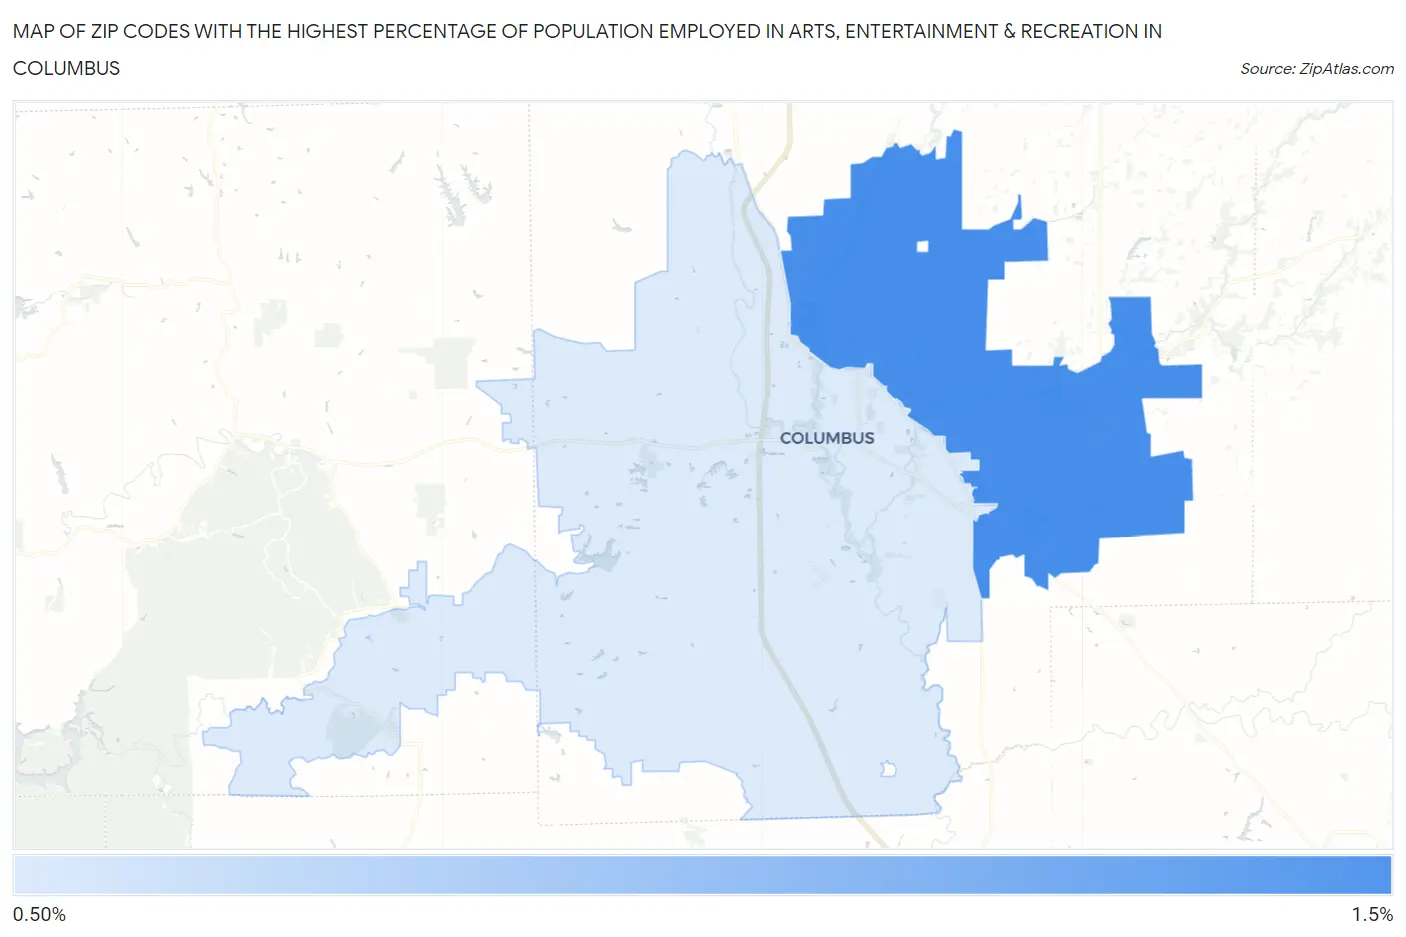
Map of Zip Codes with the Highest Percentage of Population Employed in Arts, Entertainment & Recreation in Columbus
0.0%
1.5%
Zip Codes with the Highest Percentage of Population Employed in Arts, Entertainment & Recreation in Columbus, IN
| Zip Code | % Employed | vs State | vs National | |
| 1. | 47203 | 1.5% | 1.6%(-0.181)#240 | 2.1%(-0.624)#13,530 |
| 2. | 47201 | 1.4% | 1.6%(-0.212)#248 | 2.1%(-0.655)#13,772 |
1
Common Questions
What are the Top Zip Codes with the Highest Percentage of Population Employed in Arts, Entertainment & Recreation in Columbus, IN?
Top Zip Codes with the Highest Percentage of Population Employed in Arts, Entertainment & Recreation in Columbus, IN are:
What zip code has the Highest Percentage of Population Employed in Arts, Entertainment & Recreation in Columbus, IN?
47203 has the Highest Percentage of Population Employed in Arts, Entertainment & Recreation in Columbus, IN with 1.5%.
What is the Percentage of Population Employed in Arts, Entertainment & Recreation in Columbus, IN?
Percentage of Population Employed in Arts, Entertainment & Recreation in Columbus is 1.3%.
What is the Percentage of Population Employed in Arts, Entertainment & Recreation in Indiana?
Percentage of Population Employed in Arts, Entertainment & Recreation in Indiana is 1.6%.
What is the Percentage of Population Employed in Arts, Entertainment & Recreation in the United States?
Percentage of Population Employed in Arts, Entertainment & Recreation in the United States is 2.1%.