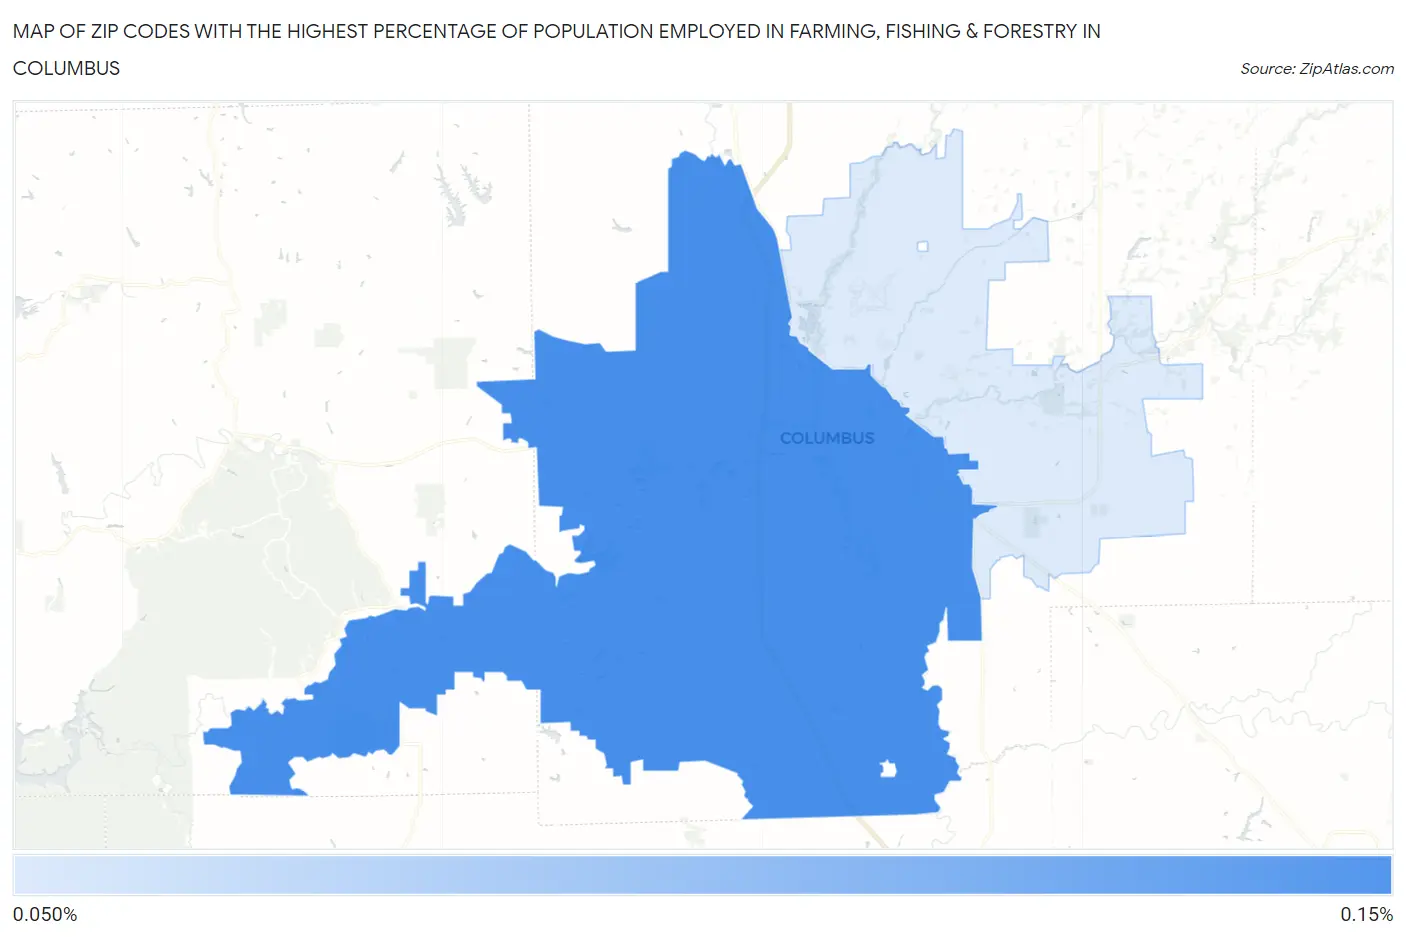
Zip Codes with the Highest Percentage of Population Employed in Farming, Fishing & Forestry in Columbus, IN
RELATED REPORTS & OPTIONS
Farming, Fishing & Forestry
Columbus
Compare Zip Codes
Map of Zip Codes with the Highest Percentage of Population Employed in Farming, Fishing & Forestry in Columbus
0.0%
0.15%
Zip Codes with the Highest Percentage of Population Employed in Farming, Fishing & Forestry in Columbus, IN
| Zip Code | % Employed | vs State | vs National | |
| 1. | 47201 | 0.13% | 0.39%(-0.259)#379 | 0.61%(-0.479)#17,317 |
| 2. | 47203 | 0.076% | 0.39%(-0.309)#393 | 0.61%(-0.529)#18,189 |
1
Common Questions
What are the Top Zip Codes with the Highest Percentage of Population Employed in Farming, Fishing & Forestry in Columbus, IN?
Top Zip Codes with the Highest Percentage of Population Employed in Farming, Fishing & Forestry in Columbus, IN are:
What zip code has the Highest Percentage of Population Employed in Farming, Fishing & Forestry in Columbus, IN?
47201 has the Highest Percentage of Population Employed in Farming, Fishing & Forestry in Columbus, IN with 0.13%.
What is the Percentage of Population Employed in Farming, Fishing & Forestry in Indiana?
Percentage of Population Employed in Farming, Fishing & Forestry in Indiana is 0.39%.
What is the Percentage of Population Employed in Farming, Fishing & Forestry in the United States?
Percentage of Population Employed in Farming, Fishing & Forestry in the United States is 0.61%.