Zip Codes with the Highest Percentage of Population Employed in Arts, Entertainment & Recreation in Urbana, IL
RELATED REPORTS & OPTIONS
Arts, Entertainment & Recreation
Urbana
Compare Zip Codes
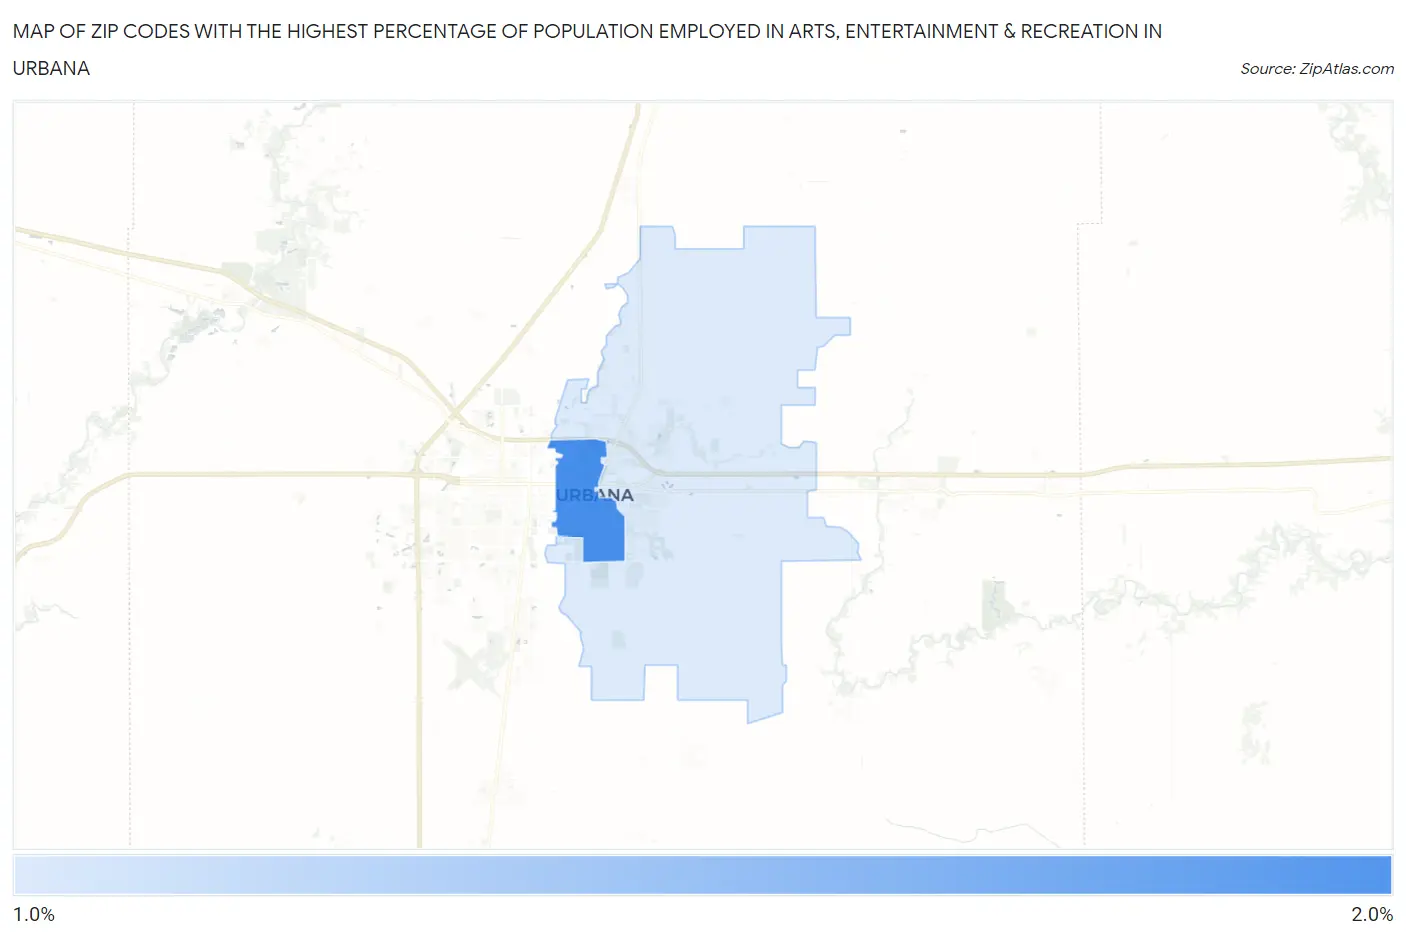
Map of Zip Codes with the Highest Percentage of Population Employed in Arts, Entertainment & Recreation in Urbana
0.0%
2.0%
Zip Codes with the Highest Percentage of Population Employed in Arts, Entertainment & Recreation in Urbana, IL
| Zip Code | % Employed | vs State | vs National | |
| 1. | 61801 | 1.7% | 1.9%(-0.229)#427 | 2.1%(-0.377)#11,696 |
| 2. | 61802 | 1.1% | 1.9%(-0.874)#644 | 2.1%(-1.02)#16,534 |
1
Common Questions
What are the Top Zip Codes with the Highest Percentage of Population Employed in Arts, Entertainment & Recreation in Urbana, IL?
Top Zip Codes with the Highest Percentage of Population Employed in Arts, Entertainment & Recreation in Urbana, IL are:
What zip code has the Highest Percentage of Population Employed in Arts, Entertainment & Recreation in Urbana, IL?
61801 has the Highest Percentage of Population Employed in Arts, Entertainment & Recreation in Urbana, IL with 1.7%.
What is the Percentage of Population Employed in Arts, Entertainment & Recreation in Urbana, IL?
Percentage of Population Employed in Arts, Entertainment & Recreation in Urbana is 1.5%.
What is the Percentage of Population Employed in Arts, Entertainment & Recreation in Illinois?
Percentage of Population Employed in Arts, Entertainment & Recreation in Illinois is 1.9%.
What is the Percentage of Population Employed in Arts, Entertainment & Recreation in the United States?
Percentage of Population Employed in Arts, Entertainment & Recreation in the United States is 2.1%.