Zip Codes with the Highest Percentage of Population Employed in Farming, Fishing & Forestry in Urbana, IL
RELATED REPORTS & OPTIONS
Farming, Fishing & Forestry
Urbana
Compare Zip Codes
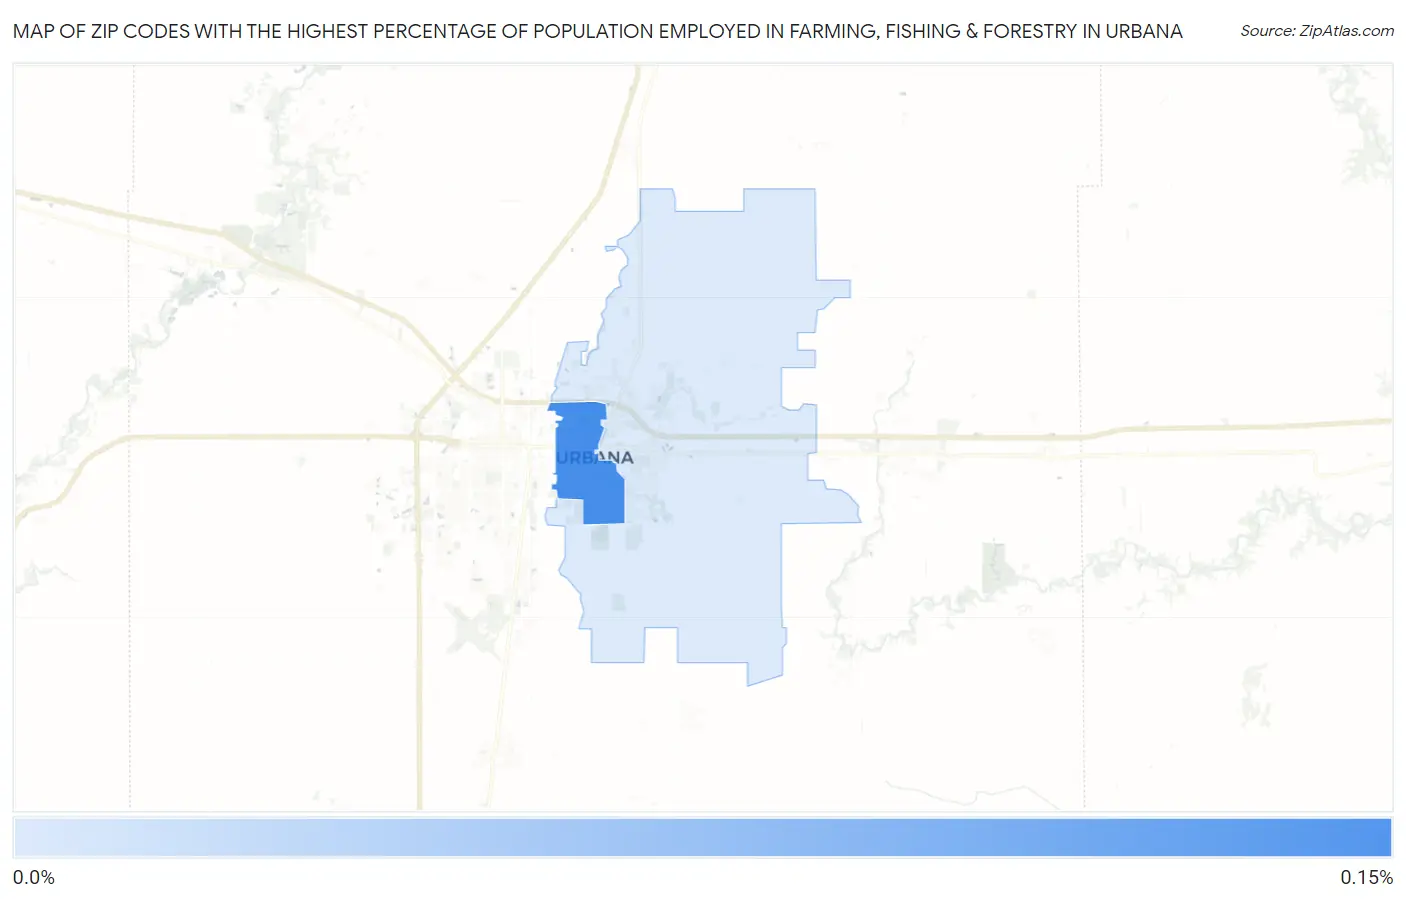
Map of Zip Codes with the Highest Percentage of Population Employed in Farming, Fishing & Forestry in Urbana
0.0%
0.15%
Zip Codes with the Highest Percentage of Population Employed in Farming, Fishing & Forestry in Urbana, IL
| Zip Code | % Employed | vs State | vs National | |
| 1. | 61801 | 0.14% | 0.31%(-0.166)#745 | 0.61%(-0.461)#17,018 |
| 2. | 61802 | 0.042% | 0.31%(-0.269)#818 | 0.61%(-0.564)#18,786 |
1
Common Questions
What are the Top Zip Codes with the Highest Percentage of Population Employed in Farming, Fishing & Forestry in Urbana, IL?
Top Zip Codes with the Highest Percentage of Population Employed in Farming, Fishing & Forestry in Urbana, IL are:
What zip code has the Highest Percentage of Population Employed in Farming, Fishing & Forestry in Urbana, IL?
61801 has the Highest Percentage of Population Employed in Farming, Fishing & Forestry in Urbana, IL with 0.14%.
What is the Percentage of Population Employed in Farming, Fishing & Forestry in Urbana, IL?
Percentage of Population Employed in Farming, Fishing & Forestry in Urbana is 0.10%.
What is the Percentage of Population Employed in Farming, Fishing & Forestry in Illinois?
Percentage of Population Employed in Farming, Fishing & Forestry in Illinois is 0.31%.
What is the Percentage of Population Employed in Farming, Fishing & Forestry in the United States?
Percentage of Population Employed in Farming, Fishing & Forestry in the United States is 0.61%.