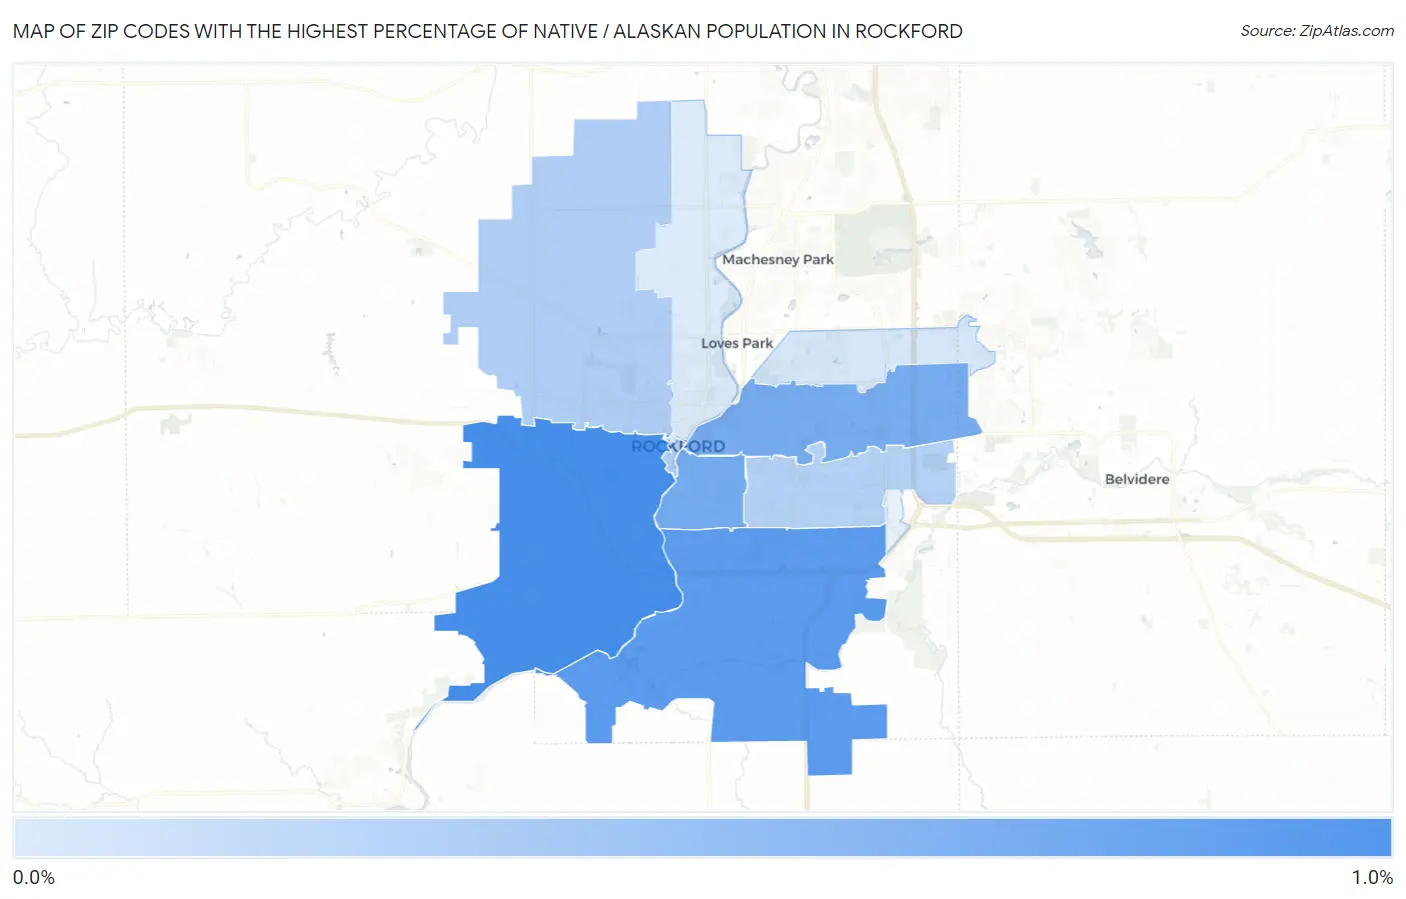
Zip Codes with the Highest Percentage of Native / Alaskan Population in Rockford, IL
RELATED REPORTS & OPTIONS
Native / Alaskan
Rockford
Compare Zip Codes
Map of Zip Codes with the Highest Percentage of Native / Alaskan Population in Rockford
0.0085%
0.90%
Zip Codes with the Highest Percentage of Native / Alaskan Population in Rockford, IL
| Zip Code | Native / Alaskan | vs State | vs National | |
| 1. | 61102 | 0.90% | 0.44%(+0.463)#92 | 0.84%(+0.059)#5,621 |
| 2. | 61109 | 0.79% | 0.44%(+0.355)#107 | 0.84%(-0.049)#6,191 |
| 3. | 61104 | 0.62% | 0.44%(+0.185)#142 | 0.84%(-0.219)#7,318 |
| 4. | 61107 | 0.62% | 0.44%(+0.178)#147 | 0.84%(-0.226)#7,367 |
| 5. | 61101 | 0.28% | 0.44%(-0.159)#271 | 0.84%(-0.563)#11,276 |
| 6. | 61108 | 0.24% | 0.44%(-0.198)#301 | 0.84%(-0.602)#11,999 |
| 7. | 61114 | 0.053% | 0.44%(-0.384)#502 | 0.84%(-0.788)#16,723 |
| 8. | 61103 | 0.0085% | 0.44%(-0.429)#566 | 0.84%(-0.833)#17,968 |
1
Common Questions
What are the Top 5 Zip Codes with the Highest Percentage of Native / Alaskan Population in Rockford, IL?
Top 5 Zip Codes with the Highest Percentage of Native / Alaskan Population in Rockford, IL are:
What zip code has the Highest Percentage of Native / Alaskan Population in Rockford, IL?
61102 has the Highest Percentage of Native / Alaskan Population in Rockford, IL with 0.90%.
What is the Percentage of Native / Alaskan Population in Rockford, IL?
Percentage of Native / Alaskan Population in Rockford is 0.47%.
What is the Percentage of Native / Alaskan Population in Illinois?
Percentage of Native / Alaskan Population in Illinois is 0.44%.
What is the Percentage of Native / Alaskan Population in the United States?
Percentage of Native / Alaskan Population in the United States is 0.84%.