Zip Codes with the Highest Percentage of Population Employed in Farming, Fishing & Forestry in Rockford, IL
RELATED REPORTS & OPTIONS
Farming, Fishing & Forestry
Rockford
Compare Zip Codes
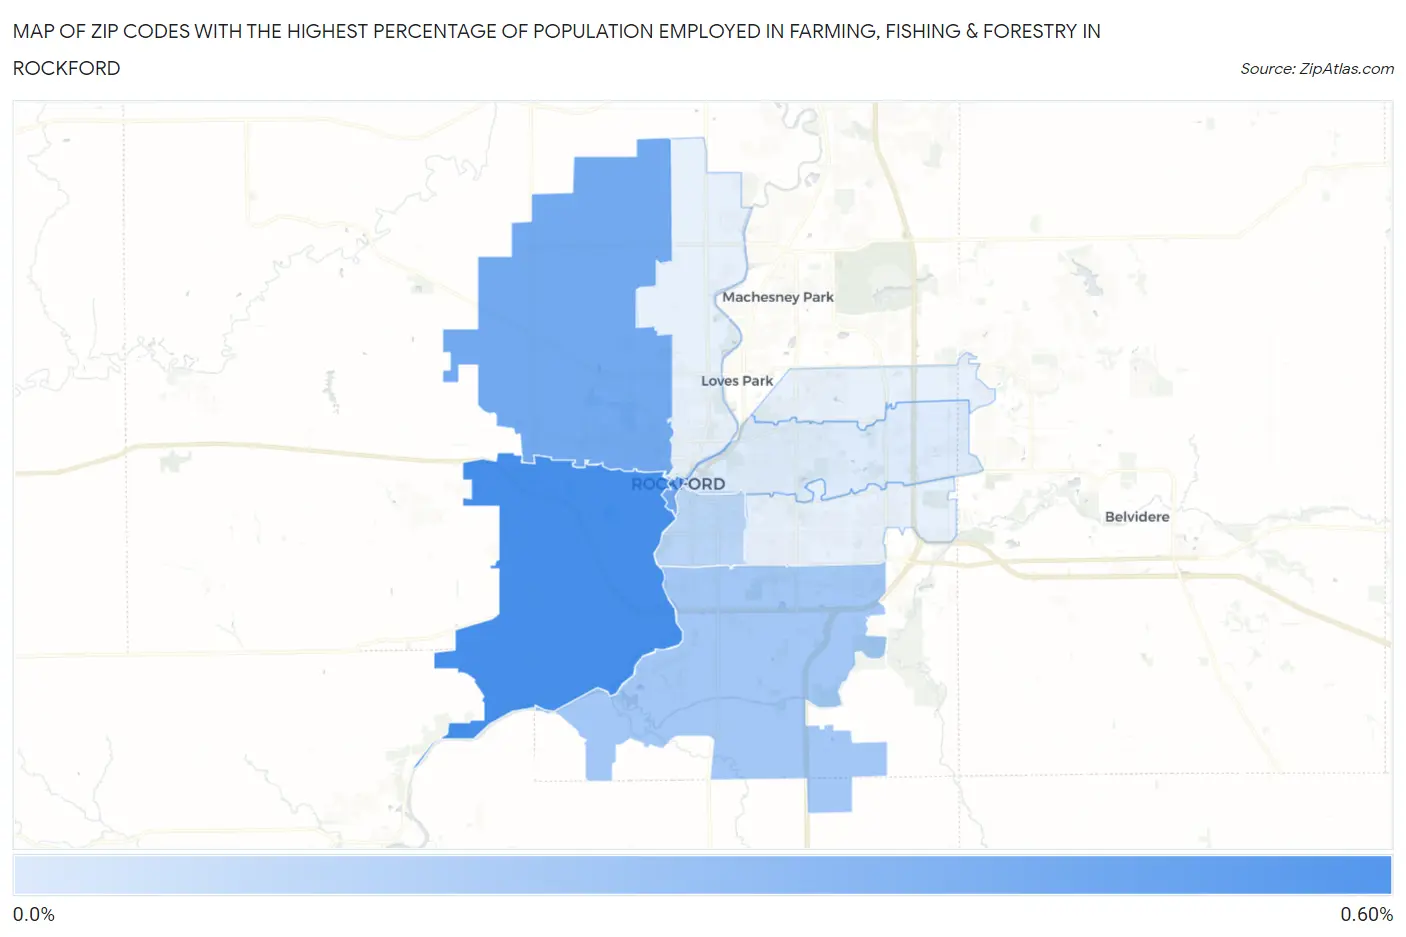
Map of Zip Codes with the Highest Percentage of Population Employed in Farming, Fishing & Forestry in Rockford
0.0%
0.60%
Zip Codes with the Highest Percentage of Population Employed in Farming, Fishing & Forestry in Rockford, IL
| Zip Code | % Employed | vs State | vs National | |
| 1. | 61102 | 0.50% | 0.31%(+0.191)#569 | 0.61%(-0.104)#12,829 |
| 2. | 61101 | 0.36% | 0.31%(+0.053)#612 | 0.61%(-0.242)#14,116 |
| 3. | 61109 | 0.22% | 0.31%(-0.089)#701 | 0.61%(-0.384)#15,816 |
| 4. | 61104 | 0.15% | 0.31%(-0.164)#742 | 0.61%(-0.459)#16,978 |
| 5. | 61107 | 0.044% | 0.31%(-0.267)#816 | 0.61%(-0.562)#18,757 |
1
Common Questions
What are the Top 5 Zip Codes with the Highest Percentage of Population Employed in Farming, Fishing & Forestry in Rockford, IL?
Top 5 Zip Codes with the Highest Percentage of Population Employed in Farming, Fishing & Forestry in Rockford, IL are:
What zip code has the Highest Percentage of Population Employed in Farming, Fishing & Forestry in Rockford, IL?
61102 has the Highest Percentage of Population Employed in Farming, Fishing & Forestry in Rockford, IL with 0.50%.
What is the Percentage of Population Employed in Farming, Fishing & Forestry in Rockford, IL?
Percentage of Population Employed in Farming, Fishing & Forestry in Rockford is 0.12%.
What is the Percentage of Population Employed in Farming, Fishing & Forestry in Illinois?
Percentage of Population Employed in Farming, Fishing & Forestry in Illinois is 0.31%.
What is the Percentage of Population Employed in Farming, Fishing & Forestry in the United States?
Percentage of Population Employed in Farming, Fishing & Forestry in the United States is 0.61%.