Zip Codes with the Highest Percentage of Hispanic or Latino Population in Peoria, IL
RELATED REPORTS & OPTIONS
Hispanic or Latino
Peoria
Compare Zip Codes
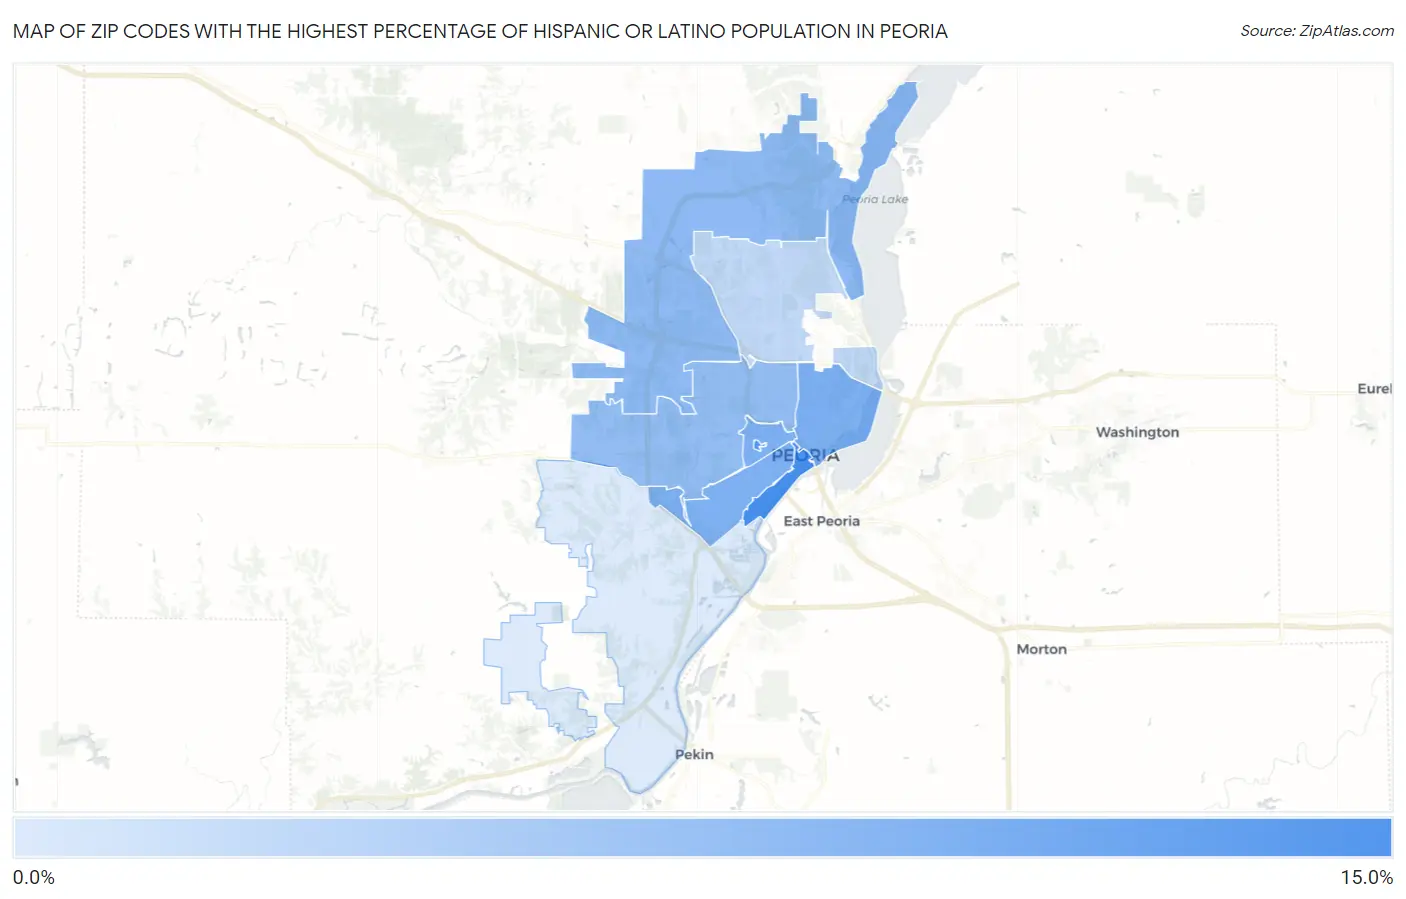
Map of Zip Codes with the Highest Percentage of Hispanic or Latino Population in Peoria
1.5%
12.9%
Zip Codes with the Highest Percentage of Hispanic or Latino Population in Peoria, IL
| Zip Code | Hispanic or Latino | vs State | vs National | |
| 1. | 61602 | 12.9% | 17.8%(-4.96)#221 | 18.7%(-5.77)#7,314 |
| 2. | 61625 | 12.1% | 17.8%(-5.74)#232 | 18.7%(-6.55)#7,698 |
| 3. | 61603 | 8.7% | 17.8%(-9.13)#322 | 18.7%(-9.94)#9,935 |
| 4. | 61606 | 8.6% | 17.8%(-9.24)#329 | 18.7%(-10.1)#10,048 |
| 5. | 61605 | 8.5% | 17.8%(-9.36)#333 | 18.7%(-10.2)#10,152 |
| 6. | 61615 | 7.3% | 17.8%(-10.6)#377 | 18.7%(-11.4)#11,292 |
| 7. | 61604 | 6.9% | 17.8%(-10.9)#397 | 18.7%(-11.8)#11,729 |
| 8. | 61614 | 3.5% | 17.8%(-14.3)#616 | 18.7%(-15.1)#17,104 |
| 9. | 61607 | 1.5% | 17.8%(-16.4)#884 | 18.7%(-17.2)#22,602 |
1
Common Questions
What are the Top 5 Zip Codes with the Highest Percentage of Hispanic or Latino Population in Peoria, IL?
Top 5 Zip Codes with the Highest Percentage of Hispanic or Latino Population in Peoria, IL are:
What zip code has the Highest Percentage of Hispanic or Latino Population in Peoria, IL?
61602 has the Highest Percentage of Hispanic or Latino Population in Peoria, IL with 12.9%.
What is the Percentage of Hispanic or Latino Population in Peoria, IL?
Percentage of Hispanic or Latino Population in Peoria is 7.1%.
What is the Percentage of Hispanic or Latino Population in Illinois?
Percentage of Hispanic or Latino Population in Illinois is 17.8%.
What is the Percentage of Hispanic or Latino Population in the United States?
Percentage of Hispanic or Latino Population in the United States is 18.7%.