Zip Codes with the Highest Percentage of Population Employed in Farming, Fishing & Forestry in Palatine, IL
RELATED REPORTS & OPTIONS
Farming, Fishing & Forestry
Palatine
Compare Zip Codes
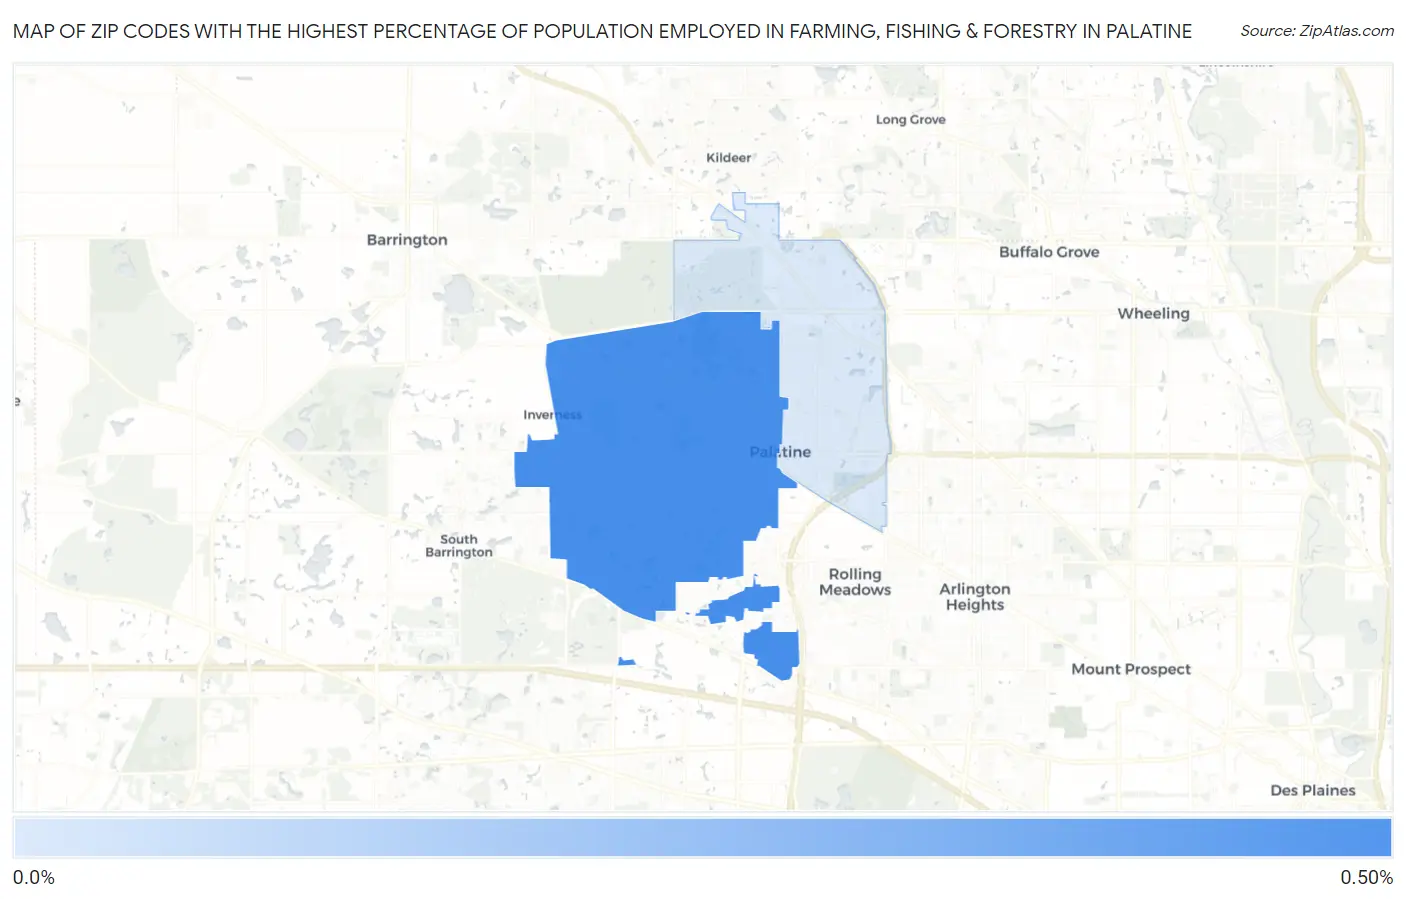
Map of Zip Codes with the Highest Percentage of Population Employed in Farming, Fishing & Forestry in Palatine
0.0%
0.50%
Zip Codes with the Highest Percentage of Population Employed in Farming, Fishing & Forestry in Palatine, IL
| Zip Code | % Employed | vs State | vs National | |
| 1. | 60067 | 0.42% | 0.31%(+0.107)#589 | 0.61%(-0.188)#13,606 |
| 2. | 60074 | 0.054% | 0.31%(-0.257)#811 | 0.61%(-0.552)#18,596 |
1
Common Questions
What are the Top Zip Codes with the Highest Percentage of Population Employed in Farming, Fishing & Forestry in Palatine, IL?
Top Zip Codes with the Highest Percentage of Population Employed in Farming, Fishing & Forestry in Palatine, IL are:
What zip code has the Highest Percentage of Population Employed in Farming, Fishing & Forestry in Palatine, IL?
60067 has the Highest Percentage of Population Employed in Farming, Fishing & Forestry in Palatine, IL with 0.42%.
What is the Percentage of Population Employed in Farming, Fishing & Forestry in Palatine, IL?
Percentage of Population Employed in Farming, Fishing & Forestry in Palatine is 0.14%.
What is the Percentage of Population Employed in Farming, Fishing & Forestry in Illinois?
Percentage of Population Employed in Farming, Fishing & Forestry in Illinois is 0.31%.
What is the Percentage of Population Employed in Farming, Fishing & Forestry in the United States?
Percentage of Population Employed in Farming, Fishing & Forestry in the United States is 0.61%.