Zip Codes with the Highest Percentage of Population Employed in Agriculture, Fishing & Hunting in Orland Park, IL
RELATED REPORTS & OPTIONS
Agriculture, Fishing & Hunting
Orland Park
Compare Zip Codes
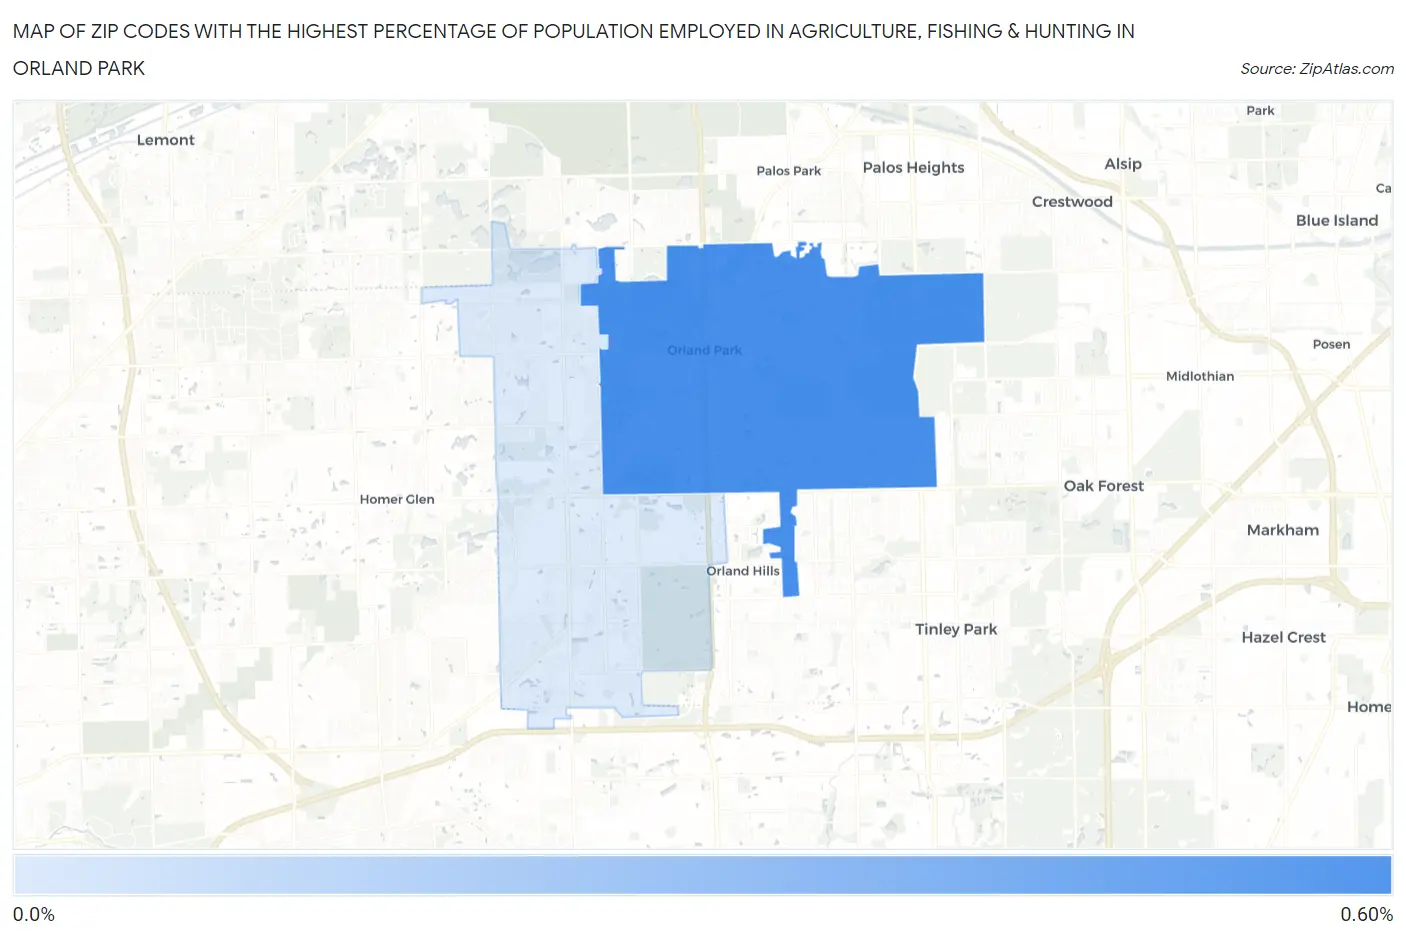
Map of Zip Codes with the Highest Percentage of Population Employed in Agriculture, Fishing & Hunting in Orland Park
0.0%
0.60%
Zip Codes with the Highest Percentage of Population Employed in Agriculture, Fishing & Hunting in Orland Park, IL
| Zip Code | % Employed | vs State | vs National | |
| 1. | 60462 | 0.54% | 0.88%(-0.341)#906 | 1.2%(-0.663)#18,961 |
| 2. | 60467 | 0.11% | 0.88%(-0.770)#1,081 | 1.2%(-1.09)#23,560 |
1
Common Questions
What are the Top Zip Codes with the Highest Percentage of Population Employed in Agriculture, Fishing & Hunting in Orland Park, IL?
Top Zip Codes with the Highest Percentage of Population Employed in Agriculture, Fishing & Hunting in Orland Park, IL are:
What zip code has the Highest Percentage of Population Employed in Agriculture, Fishing & Hunting in Orland Park, IL?
60462 has the Highest Percentage of Population Employed in Agriculture, Fishing & Hunting in Orland Park, IL with 0.54%.
What is the Percentage of Population Employed in Agriculture, Fishing & Hunting in Orland Park, IL?
Percentage of Population Employed in Agriculture, Fishing & Hunting in Orland Park is 0.38%.
What is the Percentage of Population Employed in Agriculture, Fishing & Hunting in Illinois?
Percentage of Population Employed in Agriculture, Fishing & Hunting in Illinois is 0.88%.
What is the Percentage of Population Employed in Agriculture, Fishing & Hunting in the United States?
Percentage of Population Employed in Agriculture, Fishing & Hunting in the United States is 1.2%.