Zip Codes with the Highest Percentage of Population Employed in Professional & Scientific Services in Naperville, IL

RELATED REPORTS & OPTIONS

Professional & Scientific Services
Population
Families and Households
Female Fertility
Female Fertility (Unmarried)
Race (Community Size)
Race (Percentage)
Ancestry (Community Size)
AfricanAlbanianAmericanArabArgentineanArmenianAustrianBelgianBhutaneseBolivianBrazilianBritishBulgarianBurmeseCambodianCanadianCentral AmericanCentral American IndianCherokeeChileanColombianCroatianCubanCypriotCzechCzechoslovakianDanishDutchEastern EuropeanEcuadorianEgyptianEnglishEuropeanFilipinoFinnishFrenchFrench CanadianGermanGreekGuamanian / ChamorroGuatemalanHaitianHonduranHungarianIndian (Asian)IndonesianIranianIrishIroquoisItalianJamaicanJapaneseJordanianKoreanLaotianLatvianLebaneseLithuanianLuxembourgerMacedonianMalteseMexicanMexican American IndianMoroccanNative HawaiianNigerianNorthern EuropeanNorwegianPakistaniPalestinianPanamanianPeruvianPolishPortuguesePuerto RicanRomanianRussianSalvadoranScandinavianScotch-IrishScottishSerbianSlavicSlovakSloveneSouth AfricanSouth AmericanSpaniardSpanishSri LankanSubsaharan AfricanSwedishSwissThaiTurkishUkrainianVenezuelanWelshYugoslavian
Ancestry (Percentage)
AfricanAlbanianAmericanArabArgentineanArmenianAustrianBelgianBhutaneseBolivianBrazilianBritishBulgarianBurmeseCambodianCanadianCentral AmericanCentral American IndianCherokeeChileanColombianCroatianCubanCypriotCzechCzechoslovakianDanishDutchEastern EuropeanEcuadorianEgyptianEnglishEuropeanFilipinoFinnishFrenchFrench CanadianGermanGreekGuamanian / ChamorroGuatemalanHaitianHonduranHungarianIndian (Asian)IndonesianIranianIrishIroquoisItalianJamaicanJapaneseJordanianKoreanLaotianLatvianLebaneseLithuanianLuxembourgerMacedonianMalteseMexicanMexican American IndianMoroccanNative HawaiianNigerianNorthern EuropeanNorwegianPakistaniPalestinianPanamanianPeruvianPolishPortuguesePuerto RicanRomanianRussianSalvadoranScandinavianScotch-IrishScottishSerbianSlavicSlovakSloveneSouth AfricanSouth AmericanSpaniardSpanishSri LankanSubsaharan AfricanSwedishSwissThaiTurkishUkrainianVenezuelanWelshYugoslavian
Immigrant Origin (Total)
AfricaAlbaniaArgentinaAsiaAustraliaBangladeshBelarusBosnia and HerzegovinaBrazilBulgariaBurma / MyanmarCambodiaCanadaCaribbeanCentral AmericaChileChinaColombiaCroatiaCubaCzechoslovakiaDominican RepublicEastern AfricaEastern AsiaEastern EuropeEcuadorEgyptEl SalvadorEnglandEuropeFijiFranceGermanyGhanaGreeceGuatemalaHaitiHong KongHungaryIndiaIndonesiaIranIrelandIsraelItalyJamaicaJapanJordanKazakhstanKenyaKoreaKuwaitLatin AmericaLatviaLebanonLiberiaLithuaniaMalaysiaMexicoMoldovaMoroccoNetherlandsNigeriaNorth MacedoniaNorthern AfricaNorthern EuropeOceaniaPakistanPanamaPeruPhilippinesPolandRomaniaRussiaSaudi ArabiaSerbiaSingaporeSouth AfricaSouth AmericaSouth Central AsiaSouth Eastern AsiaSouthern EuropeSpainSri LankaSwitzerlandSyriaTaiwanThailandTurkeyUgandaUkraineVenezuelaVietnamWestern AfricaWestern AsiaWestern Europe
Immigrant Origin (Percentage)
AfricaAlbaniaArgentinaAsiaAustraliaBangladeshBelarusBosnia and HerzegovinaBrazilBulgariaBurma / MyanmarCambodiaCanadaCaribbeanCentral AmericaChileChinaColombiaCroatiaCubaCzechoslovakiaDominican RepublicEastern AfricaEastern AsiaEastern EuropeEcuadorEgyptEl SalvadorEnglandEuropeFijiFranceGermanyGhanaGreeceGuatemalaHaitiHong KongHungaryIndiaIndonesiaIranIrelandIsraelItalyJamaicaJapanJordanKazakhstanKenyaKoreaKuwaitLatin AmericaLatviaLebanonLiberiaLithuaniaMalaysiaMexicoMoldovaMoroccoNetherlandsNigeriaNorth MacedoniaNorthern AfricaNorthern EuropeOceaniaPakistanPanamaPeruPhilippinesPolandRomaniaRussiaSaudi ArabiaSerbiaSingaporeSouth AfricaSouth AmericaSouth Central AsiaSouth Eastern AsiaSouthern EuropeSpainSri LankaSwitzerlandSyriaTaiwanThailandTurkeyUgandaUkraineVenezuelaVietnamWestern AfricaWestern AsiaWestern Europe
Income
Income (Families)
Income (Households)
Poverty
Poverty (Families)
Unemployment
Employment Occupations
Employment Industries
Employer Class
Commute Time
Commute Means
School Enrollment
Education by Degree Field
Occupancy
Finances
Physical Characteristics
Naperville
Compare Zip Codes
Comparison Subject

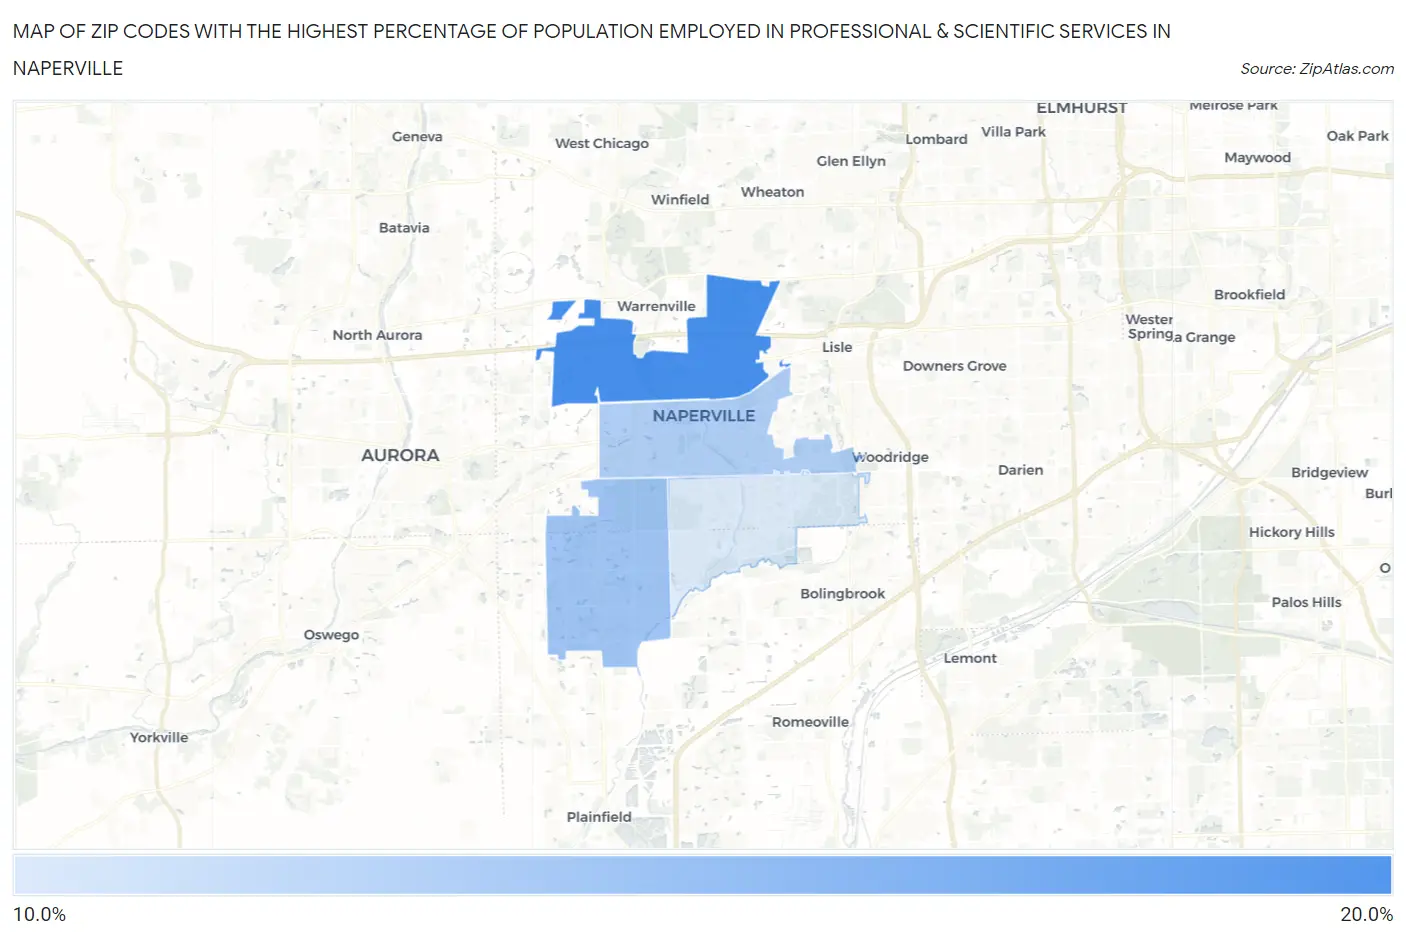
Map of Zip Codes with the Highest Percentage of Population Employed in Professional & Scientific Services in Naperville

0.0%
20.0%
Zip Codes with the Highest Percentage of Population Employed in Professional & Scientific Services in Naperville Map

Zip Codes with the Highest Percentage of Population Employed in Professional & Scientific Services in Naperville, IL

Zip Code % Employed vs State vs National
1.6056319.6%8.3%(+11.3)#337.8%(+11.8)#936
2.6056417.0%8.3%(+8.69)#437.8%(+9.18)#1,356
3.6054016.6%8.3%(+8.31)#467.8%(+8.80)#1,451
4.6056515.3%8.3%(+7.00)#607.8%(+7.49)#1,789

Common Questions

What are the Top 3 Zip Codes with the Highest Percentage of Population Employed in Professional & Scientific Services in Naperville, IL?
Top 3 Zip Codes with the Highest Percentage of Population Employed in Professional & Scientific Services in Naperville, IL are:
#1
19.6%
#2
17.0%
#3
16.6%
What zip code has the Highest Percentage of Population Employed in Professional & Scientific Services in Naperville, IL?
60563 has the Highest Percentage of Population Employed in Professional & Scientific Services in Naperville, IL with 19.6%.
What is the Percentage of Population Employed in Professional & Scientific Services in Naperville, IL?
Percentage of Population Employed in Professional & Scientific Services in Naperville is 17.5%.
What is the Percentage of Population Employed in Professional & Scientific Services in Illinois?
Percentage of Population Employed in Professional & Scientific Services in Illinois is 8.3%.
What is the Percentage of Population Employed in Professional & Scientific Services in the United States?
Percentage of Population Employed in Professional & Scientific Services in the United States is 7.8%.