Zip Codes with the Highest Percentage of Renter-Occupied Units in East Saint Louis, IL
RELATED REPORTS & OPTIONS
Highest Renter-Occupied
East Saint Louis
Compare Zip Codes
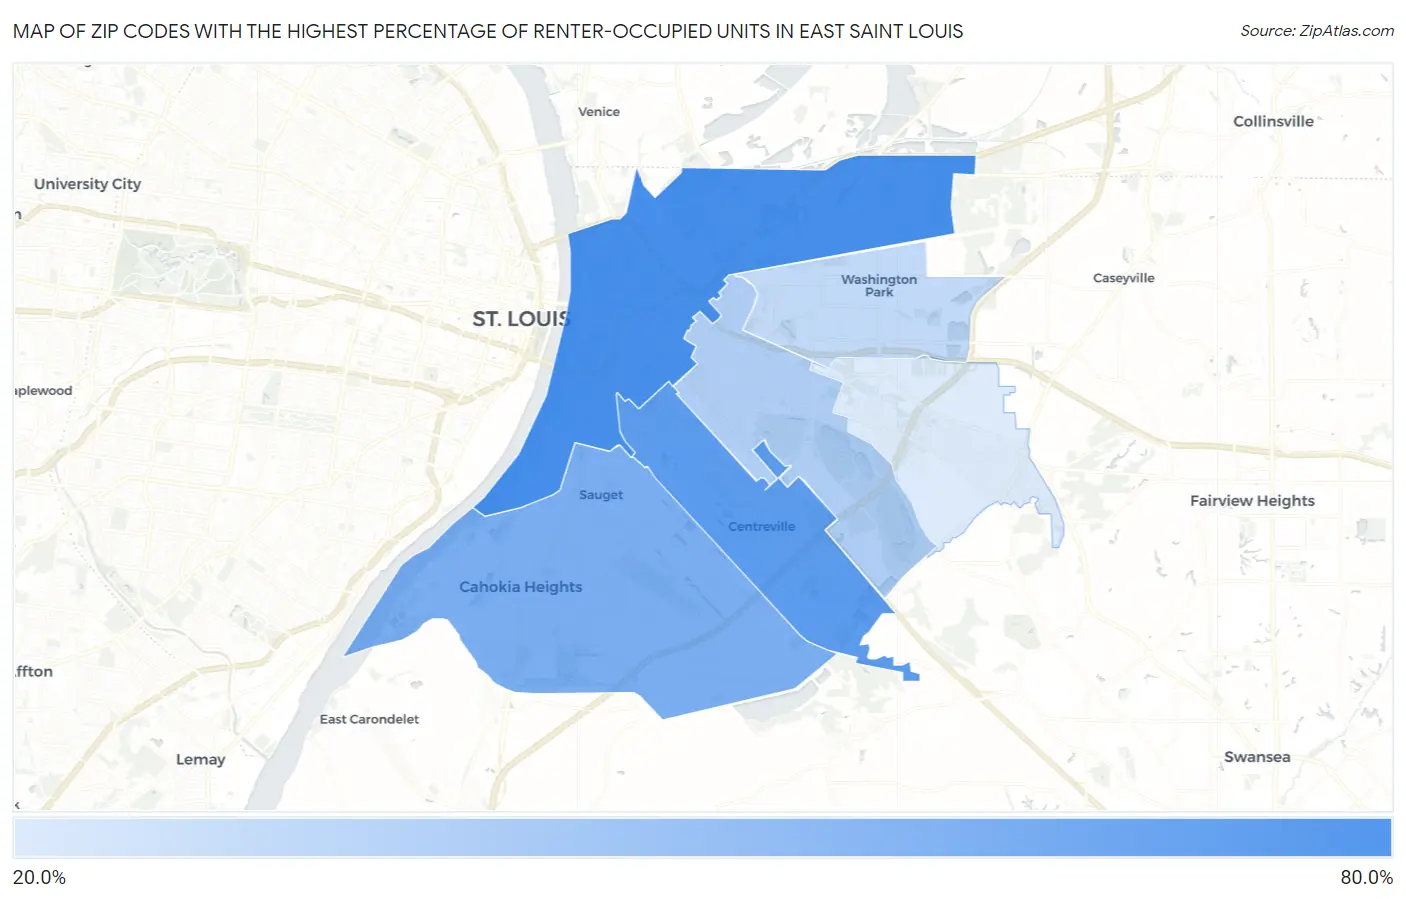
Map of Zip Codes with the Highest Percentage of Renter-Occupied Units in East Saint Louis
0.0%
80.0%
Zip Codes with the Highest Percentage of Renter-Occupied Units in East Saint Louis, IL
| Zip Code | % Renter-Occupied | vs State | vs National | |
| 1. | 62201 | 67.0% | 33.3%(+33.7)#30 | 35.2%(+31.8)#1,236 |
| 2. | 62207 | 60.8% | 33.3%(+27.5)#50 | 35.2%(+25.6)#1,734 |
| 3. | 62206 | 51.6% | 33.3%(+18.2)#71 | 35.2%(+16.4)#2,834 |
| 4. | 62205 | 37.3% | 33.3%(+3.96)#167 | 35.2%(+2.11)#6,348 |
| 5. | 62204 | 32.6% | 33.3%(-0.688)#233 | 35.2%(-2.54)#8,507 |
| 6. | 62203 | 25.6% | 33.3%(-7.72)#424 | 35.2%(-9.58)#13,135 |
1
Common Questions
What are the Top 5 Zip Codes with the Highest Percentage of Renter-Occupied Units in East Saint Louis, IL?
Top 5 Zip Codes with the Highest Percentage of Renter-Occupied Units in East Saint Louis, IL are:
What zip code has the Highest Percentage of Renter-Occupied Units in East Saint Louis, IL?
62201 has the Highest Percentage of Renter-Occupied Units in East Saint Louis, IL with 67.0%.
What is the Percentage of Renter-Occupied Units in Illinois?
Percentage of Renter-Occupied Units in Illinois is 33.3%.
What is the Percentage of Renter-Occupied Units in the United States?
Percentage of Renter-Occupied Units in the United States is 35.2%.