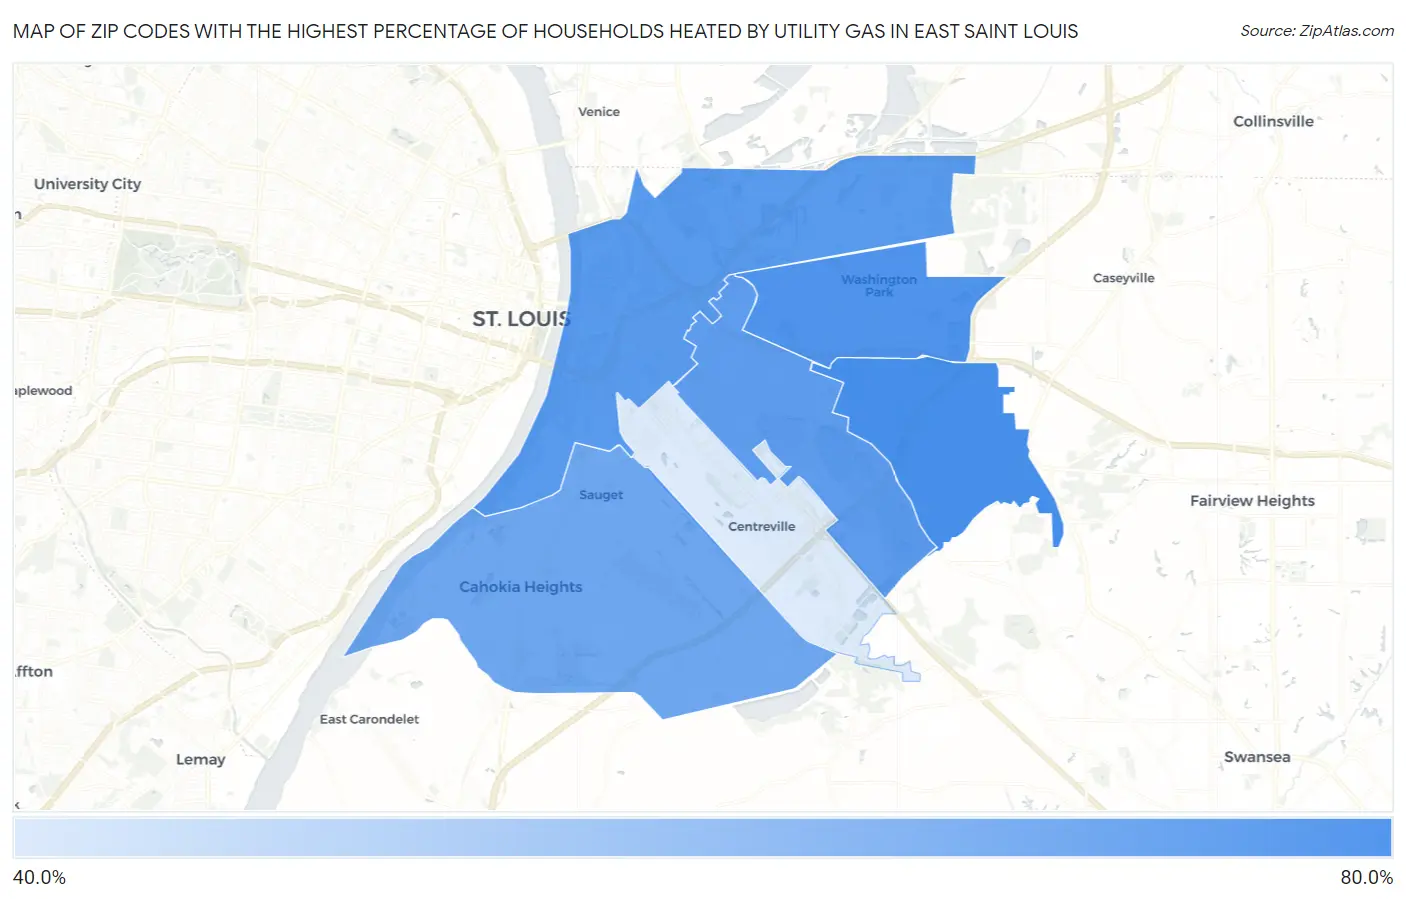
Zip Codes with the Highest Percentage of Households Heated by Utility Gas in East Saint Louis, IL
RELATED REPORTS & OPTIONS
Utility Gas Heating
East Saint Louis
Compare Zip Codes
Map of Zip Codes with the Highest Percentage of Households Heated by Utility Gas in East Saint Louis
0.0%
80.0%
Zip Codes with the Highest Percentage of Households Heated by Utility Gas in East Saint Louis, IL
| Zip Code | Utility Gas Heating | vs State | vs National | |
| 1. | 62203 | 74.6% | 76.1%(-1.50)#453 | 47.1%(+27.5)#3,511 |
| 2. | 62204 | 72.9% | 76.1%(-3.20)#485 | 47.1%(+25.8)#3,916 |
| 3. | 62201 | 71.5% | 76.1%(-4.60)#516 | 47.1%(+24.4)#4,253 |
| 4. | 62205 | 70.3% | 76.1%(-5.80)#540 | 47.1%(+23.2)#4,554 |
| 5. | 62206 | 67.6% | 76.1%(-8.50)#600 | 47.1%(+20.5)#5,286 |
| 6. | 62207 | 49.2% | 76.1%(-26.9)#952 | 47.1%(+2.10)#10,473 |
1
Common Questions
What are the Top 5 Zip Codes with the Highest Percentage of Households Heated by Utility Gas in East Saint Louis, IL?
Top 5 Zip Codes with the Highest Percentage of Households Heated by Utility Gas in East Saint Louis, IL are:
What zip code has the Highest Percentage of Households Heated by Utility Gas in East Saint Louis, IL?
62203 has the Highest Percentage of Households Heated by Utility Gas in East Saint Louis, IL with 74.6%.
What is the Percentage of Households Heated by Utility Gas in Illinois?
Percentage of Households Heated by Utility Gas in Illinois is 76.1%.
What is the Percentage of Households Heated by Utility Gas in the United States?
Percentage of Households Heated by Utility Gas in the United States is 47.1%.