Zip Codes with the Highest Percentage of Households Heated by Bottled Gas / Liquid Propane in East Saint Louis, IL
RELATED REPORTS & OPTIONS
Bottled Gas / LP Heating
East Saint Louis
Compare Zip Codes
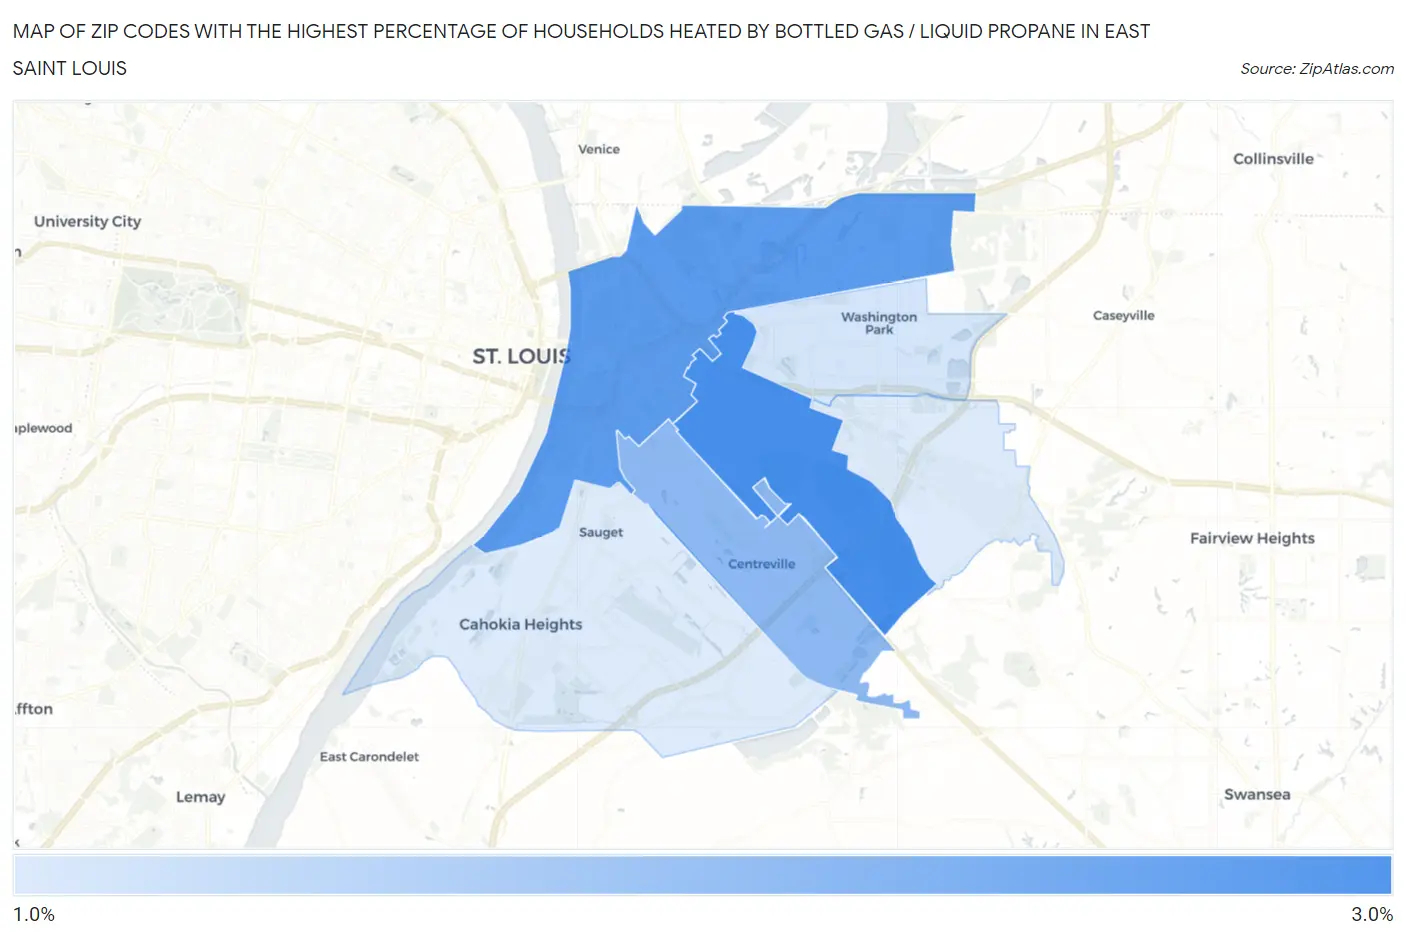
Map of Zip Codes with the Highest Percentage of Households Heated by Bottled Gas / Liquid Propane in East Saint Louis
0.0%
3.0%
Zip Codes with the Highest Percentage of Households Heated by Bottled Gas / Liquid Propane in East Saint Louis, IL
| Zip Code | Bottled Gas / LP Heating | vs State | vs National | |
| 1. | 62205 | 2.7% | 4.2%(-1.50)#924 | 4.9%(-2.20)#21,614 |
| 2. | 62201 | 2.5% | 4.2%(-1.70)#949 | 4.9%(-2.40)#22,052 |
| 3. | 62207 | 1.9% | 4.2%(-2.30)#992 | 4.9%(-3.00)#23,587 |
| 4. | 62204 | 1.1% | 4.2%(-3.10)#1,119 | 4.9%(-3.80)#26,433 |
| 5. | 62206 | 1.0% | 4.2%(-3.20)#1,139 | 4.9%(-3.90)#26,822 |
| 6. | 62203 | 1.0% | 4.2%(-3.20)#1,140 | 4.9%(-3.90)#26,861 |
1
Common Questions
What are the Top 5 Zip Codes with the Highest Percentage of Households Heated by Bottled Gas / Liquid Propane in East Saint Louis, IL?
Top 5 Zip Codes with the Highest Percentage of Households Heated by Bottled Gas / Liquid Propane in East Saint Louis, IL are:
What zip code has the Highest Percentage of Households Heated by Bottled Gas / Liquid Propane in East Saint Louis, IL?
62205 has the Highest Percentage of Households Heated by Bottled Gas / Liquid Propane in East Saint Louis, IL with 2.7%.
What is the Percentage of Households Heated by Bottled Gas / Liquid Propane in Illinois?
Percentage of Households Heated by Bottled Gas / Liquid Propane in Illinois is 4.2%.
What is the Percentage of Households Heated by Bottled Gas / Liquid Propane in the United States?
Percentage of Households Heated by Bottled Gas / Liquid Propane in the United States is 4.9%.