Zip Codes with the Highest Percentage of Population Employed in Farming, Fishing & Forestry in East Saint Louis, IL
RELATED REPORTS & OPTIONS
Farming, Fishing & Forestry
East Saint Louis
Compare Zip Codes
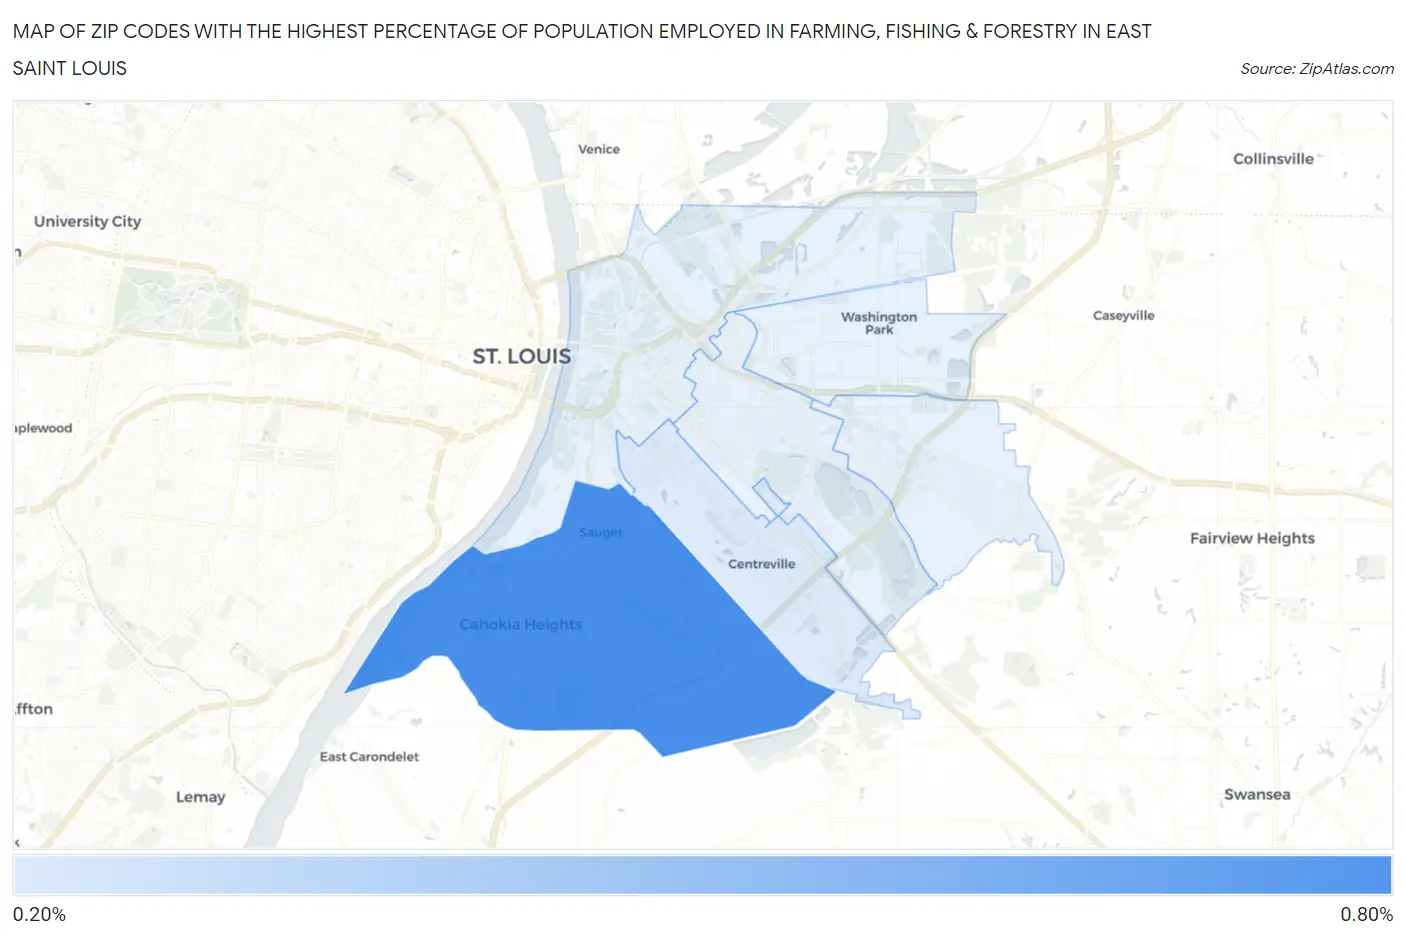
Map of Zip Codes with the Highest Percentage of Population Employed in Farming, Fishing & Forestry in East Saint Louis
0.0%
0.80%
Zip Codes with the Highest Percentage of Population Employed in Farming, Fishing & Forestry in East Saint Louis, IL
| Zip Code | % Employed | vs State | vs National | |
| 1. | 62206 | 0.80% | 0.31%(+0.485)#475 | 0.61%(+0.190)#10,808 |
| 2. | 62207 | 0.22% | 0.31%(-0.090)#702 | 0.61%(-0.385)#15,836 |
1
Common Questions
What are the Top 5 Zip Codes with the Highest Percentage of Population Employed in Farming, Fishing & Forestry in East Saint Louis, IL?
Top 5 Zip Codes with the Highest Percentage of Population Employed in Farming, Fishing & Forestry in East Saint Louis, IL are:
What zip code has the Highest Percentage of Population Employed in Farming, Fishing & Forestry in East Saint Louis, IL?
62206 has the Highest Percentage of Population Employed in Farming, Fishing & Forestry in East Saint Louis, IL with 0.80%.
What is the Percentage of Population Employed in Farming, Fishing & Forestry in Illinois?
Percentage of Population Employed in Farming, Fishing & Forestry in Illinois is 0.31%.
What is the Percentage of Population Employed in Farming, Fishing & Forestry in the United States?
Percentage of Population Employed in Farming, Fishing & Forestry in the United States is 0.61%.