Zip Codes with the Highest Percentage of Hispanic or Latino Population in Decatur, IL
RELATED REPORTS & OPTIONS
Hispanic or Latino
Decatur
Compare Zip Codes
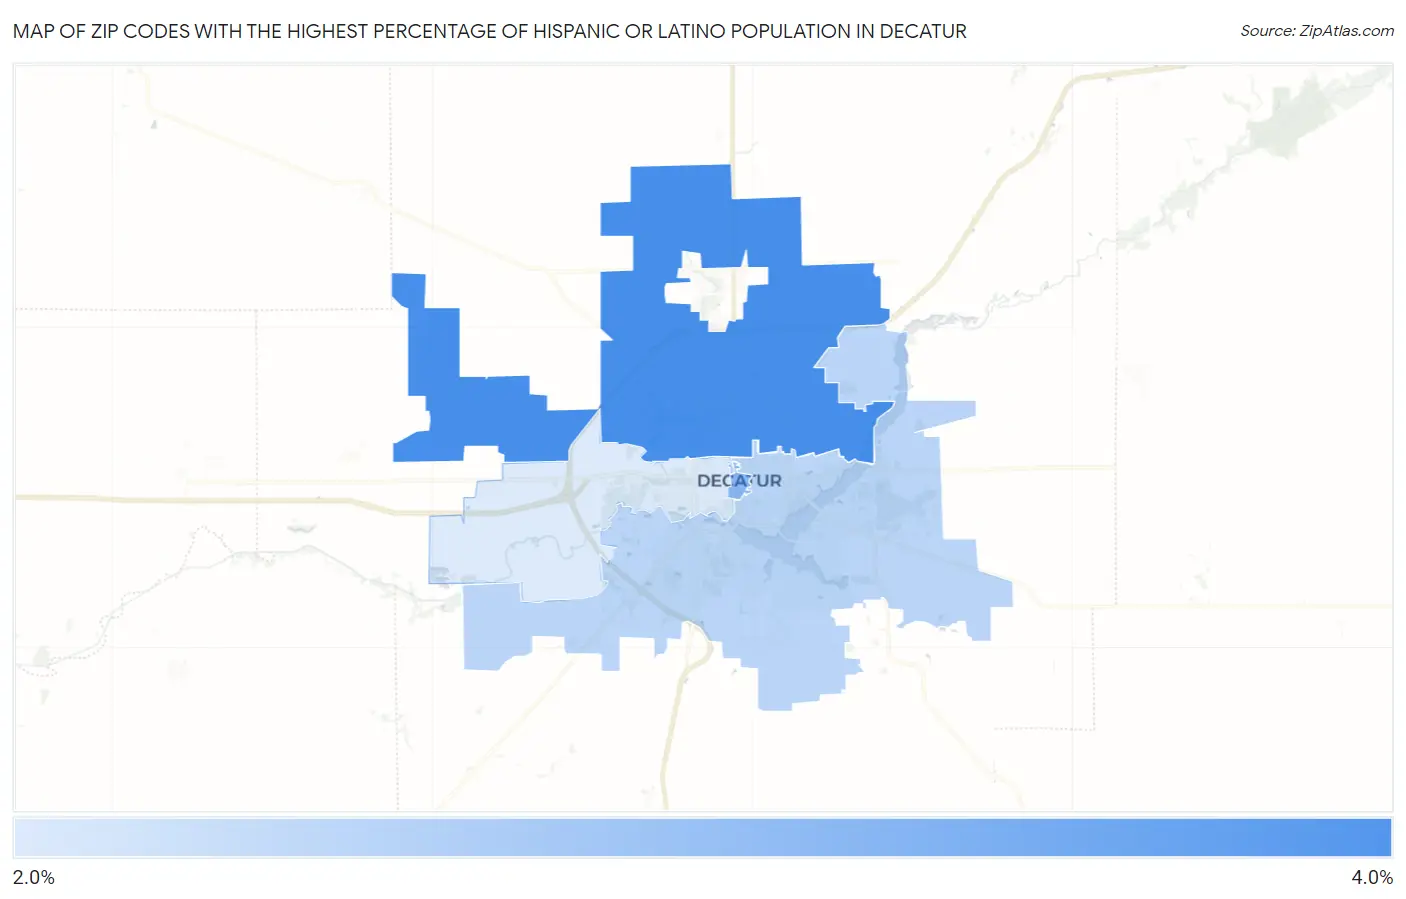
Map of Zip Codes with the Highest Percentage of Hispanic or Latino Population in Decatur
2.0%
3.3%
Zip Codes with the Highest Percentage of Hispanic or Latino Population in Decatur, IL
| Zip Code | Hispanic or Latino | vs State | vs National | |
| 1. | 62526 | 3.3% | 17.8%(-14.5)#636 | 18.7%(-15.3)#17,545 |
| 2. | 62523 | 2.8% | 17.8%(-15.1)#713 | 18.7%(-15.9)#19,023 |
| 3. | 62521 | 2.3% | 17.8%(-15.5)#774 | 18.7%(-16.4)#20,187 |
| 4. | 62522 | 2.0% | 17.8%(-15.8)#813 | 18.7%(-16.6)#21,018 |
1
Common Questions
What are the Top 3 Zip Codes with the Highest Percentage of Hispanic or Latino Population in Decatur, IL?
Top 3 Zip Codes with the Highest Percentage of Hispanic or Latino Population in Decatur, IL are:
What zip code has the Highest Percentage of Hispanic or Latino Population in Decatur, IL?
62526 has the Highest Percentage of Hispanic or Latino Population in Decatur, IL with 3.3%.
What is the Percentage of Hispanic or Latino Population in Decatur, IL?
Percentage of Hispanic or Latino Population in Decatur is 3.0%.
What is the Percentage of Hispanic or Latino Population in Illinois?
Percentage of Hispanic or Latino Population in Illinois is 17.8%.
What is the Percentage of Hispanic or Latino Population in the United States?
Percentage of Hispanic or Latino Population in the United States is 18.7%.