Zip Codes with the Highest Percentage of White / Caucasian Population in Danville, IL
RELATED REPORTS & OPTIONS
White / Caucasian
Danville
Compare Zip Codes
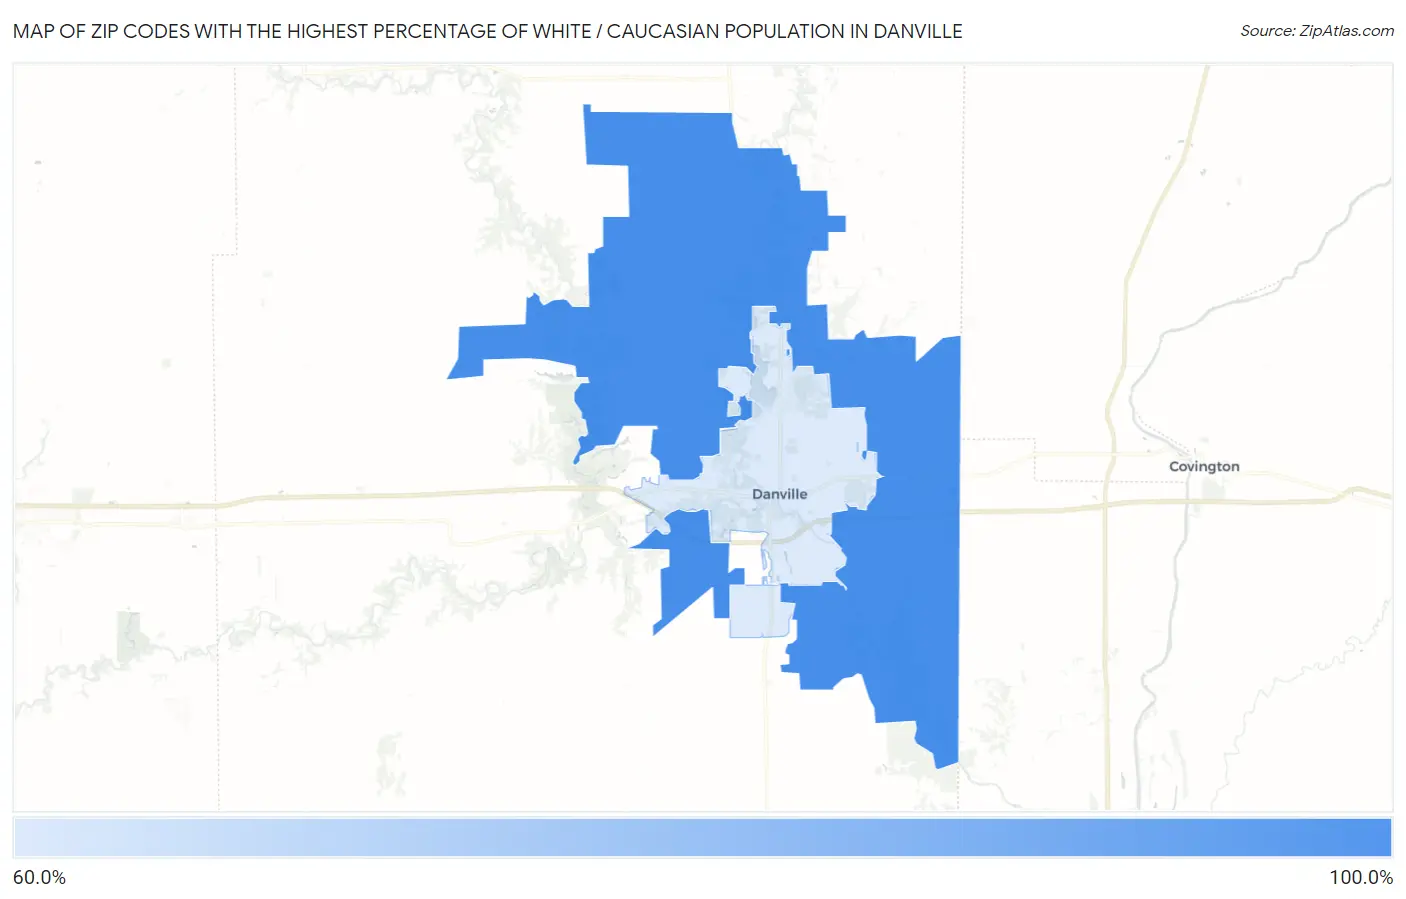
Map of Zip Codes with the Highest Percentage of White / Caucasian Population in Danville
64.6%
81.8%
Zip Codes with the Highest Percentage of White / Caucasian Population in Danville, IL
| Zip Code | White / Caucasian | vs State | vs National | |
| 1. | 61834 | 81.8% | 65.8%(+16.1)#1,029 | 65.9%(+15.9)#20,091 |
| 2. | 61832 | 64.6% | 65.8%(-1.13)#1,203 | 65.9%(-1.26)#26,224 |
1
Common Questions
What are the Top Zip Codes with the Highest Percentage of White / Caucasian Population in Danville, IL?
Top Zip Codes with the Highest Percentage of White / Caucasian Population in Danville, IL are:
What zip code has the Highest Percentage of White / Caucasian Population in Danville, IL?
61834 has the Highest Percentage of White / Caucasian Population in Danville, IL with 81.8%.
What is the Percentage of White / Caucasian Population in Danville, IL?
Percentage of White / Caucasian Population in Danville is 58.6%.
What is the Percentage of White / Caucasian Population in Illinois?
Percentage of White / Caucasian Population in Illinois is 65.8%.
What is the Percentage of White / Caucasian Population in the United States?
Percentage of White / Caucasian Population in the United States is 65.9%.