Zip Codes with the Highest Percentage of Self-Employed / Incorporated in Danville, IL
RELATED REPORTS & OPTIONS
Self-Employed / Incorporated
Danville
Compare Zip Codes
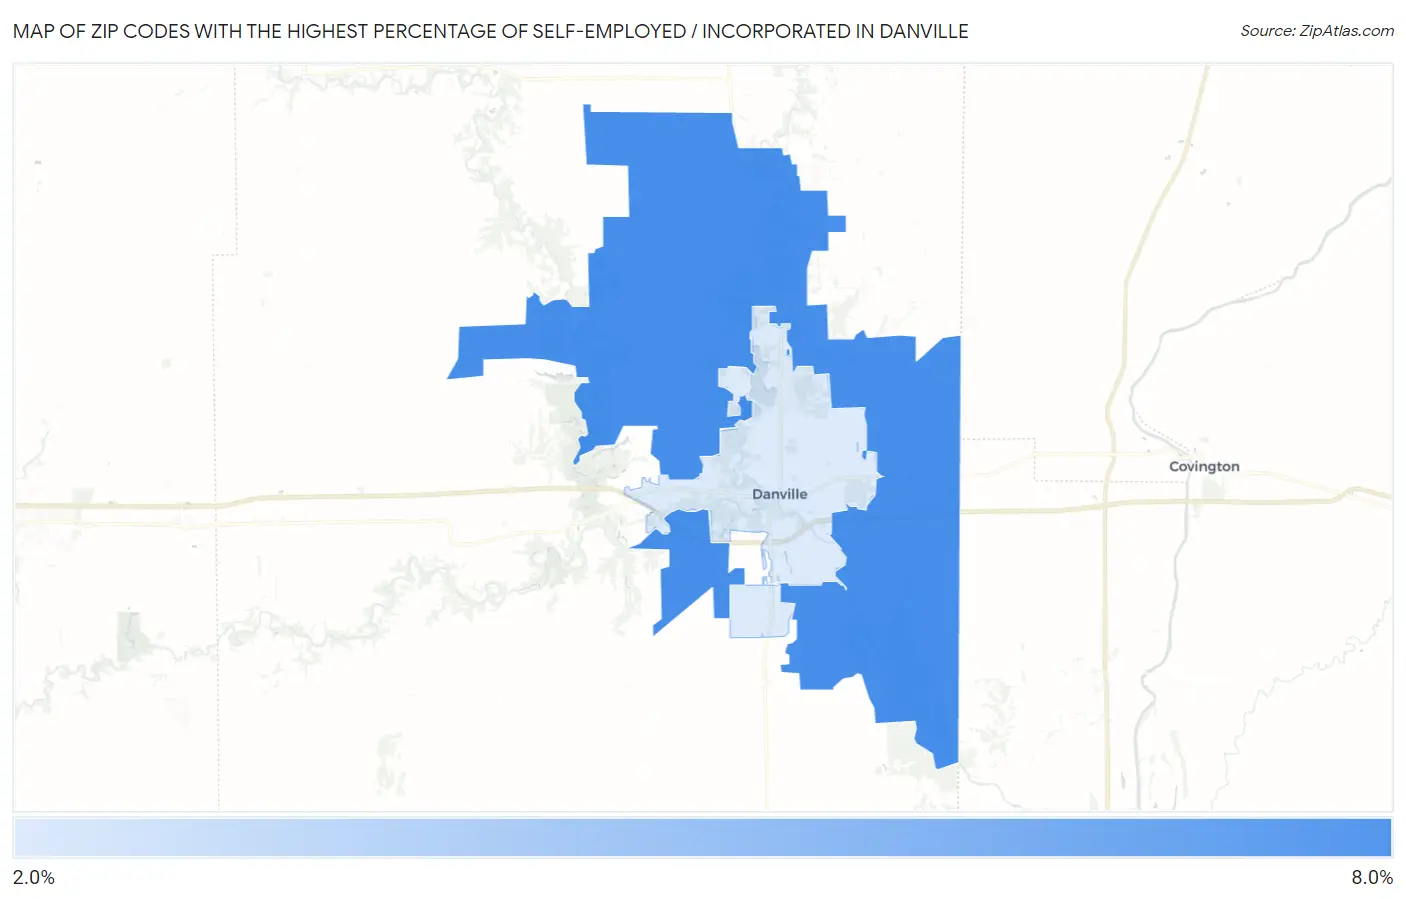
Map of Zip Codes with the Highest Percentage of Self-Employed / Incorporated in Danville
2.2%
6.0%
Zip Codes with the Highest Percentage of Self-Employed / Incorporated in Danville, IL
| Zip Code | % Self-Employed / Incorporated | vs State | vs National | |
| 1. | 61834 | 6.0% | 4.0%(+1.96)#237 | 3.8%(+2.19)#6,300 |
| 2. | 61832 | 2.2% | 4.0%(-1.81)#835 | 3.8%(-1.58)#20,163 |
1
Common Questions
What are the Top Zip Codes with the Highest Percentage of Self-Employed / Incorporated in Danville, IL?
Top Zip Codes with the Highest Percentage of Self-Employed / Incorporated in Danville, IL are:
What zip code has the Highest Percentage of Self-Employed / Incorporated in Danville, IL?
61834 has the Highest Percentage of Self-Employed / Incorporated in Danville, IL with 6.0%.
What is the Percentage of Self-Employed / Incorporated in Danville, IL?
Percentage of Self-Employed / Incorporated in Danville is 1.7%.
What is the Percentage of Self-Employed / Incorporated in Illinois?
Percentage of Self-Employed / Incorporated in Illinois is 4.0%.
What is the Percentage of Self-Employed / Incorporated in the United States?
Percentage of Self-Employed / Incorporated in the United States is 3.8%.